統計機能
From LimeSurvey Manual
概要
統計機能を使用するには、統計ツールバーの最後の回答というドロップダウンメニュー(アンケートが実行中の時だけ使えます)の最初にある"回答と統計"をクリックします。

上部のツールバーにある統計ボタンをクリックします。

以下のページが表示されます。

The LimeSurvey statistics can be visualized in either the expert mode or simple mode. By default, the expert mode is loaded when you click on the Statistics button.
統計 - 上級者モード
アンケートを実行し、終了して、結果についての分析に着手するところであるとします。LimeSurveyはすべての結果をExcelのシート(もしくはCSVファイルやWordのファイル)に出力するので、あとは分析者のお好みのままに、あれこれ加工できます。これとは別に、統計機能を利用してデータを閲覧し、有益な情報を得ることができます。
統計機能を用いれば、データを「フィルタ」し、いくつかのフィールドから統計数値や概要を得ることができます。この機能は複雑なフィルタリングを提供しようというものではありませんが、基本的な統計情報を驚くほど簡単に得ることができます。
結果とフィールド概要を見る
"統計を表示"ボタンをクリックすると、 利用可能な質問のリストが表示されます。各々の質問にあるチェックボックスを選択するとテーブルの概要を見ることができ、アイコンをクリックまたはカーソルを合わせると質問の全文を見ることができます。質問に対する結果を閲覧するには、質問の上部のチェックボックスをチェックし、"統計を表示"をクリックします。または、画面上部の"利用可能な全フィールドの概要を表示"ボックスをチェックし、"統計を表示"をクリックします。
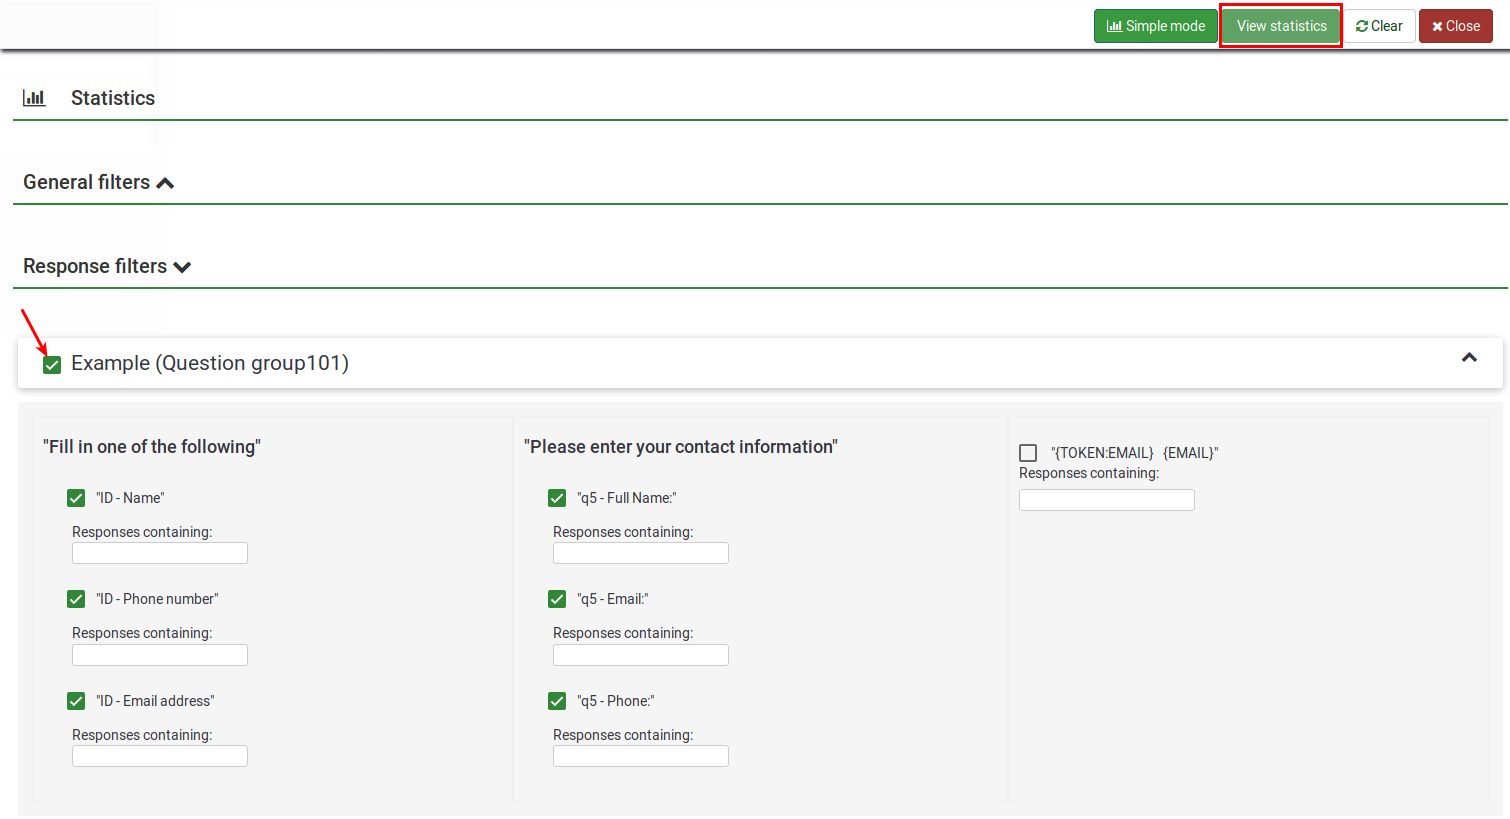
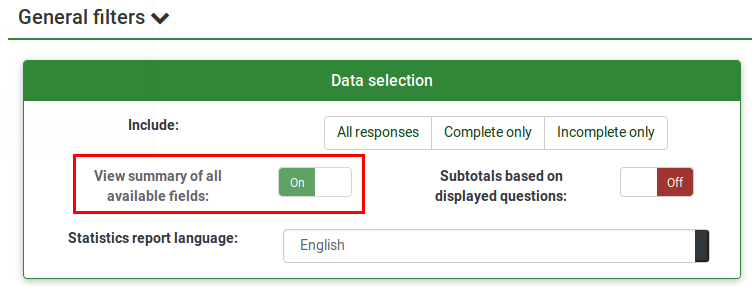
Alternatively, to view the results for all available questions, enable "View summary of all available fields" and then click "View statistics":
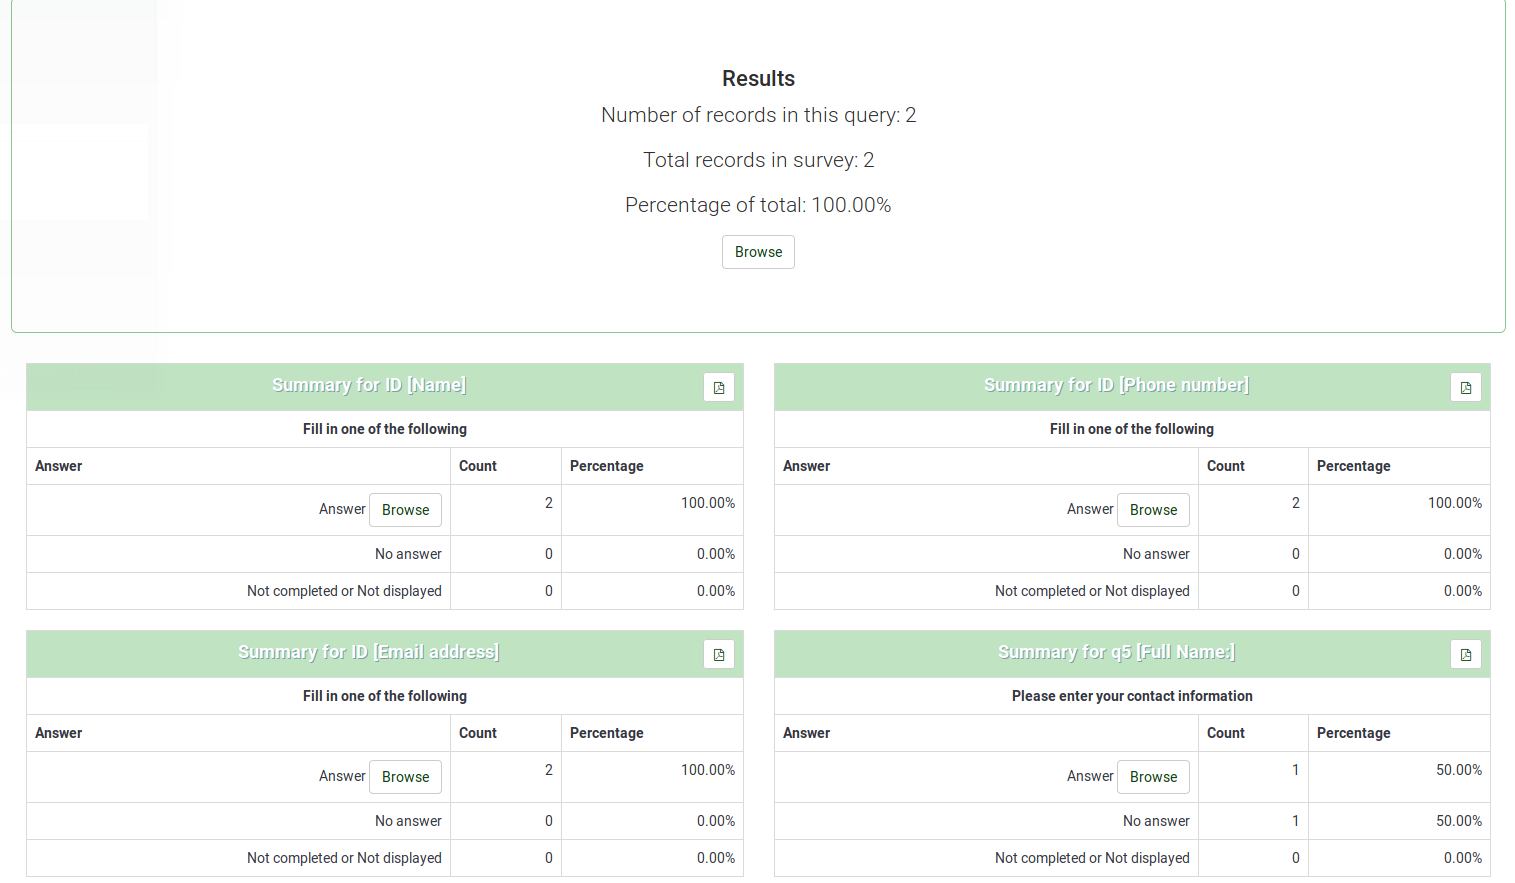
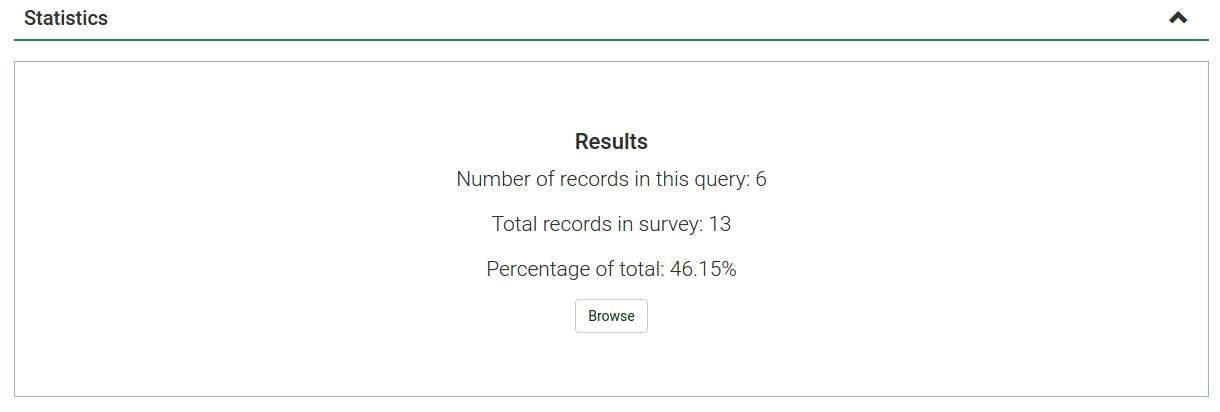
「統計を表示」をクリックすると、指定したフィルタのもとで、チェックを入れた質問の回答についての統計情報が表示されます。全体についてはクエリに含まれるレコード数、全レコード数、百分率が、各質問については、選択肢ごとの回答者数、および、その百分率が表示されます。
回答をフィルタして統計を取る
Two types of filters exist: general and response filters.
General filters
データはいくつかの方法でフィルタリングできます。
- アンケートの完了 - 完了、未完了、またはすべてのレコードを選択します。不完了の回答については、アンケート結果の閲覧を参照してください。
- ID - 入力したID番号によってフィルターします。
- 回答 - 各質問の下にあるリストで回答をクリックし、その回答によってデータをフィルタリングします(同じ質問で複数の回答を選択するにはCTRLを押しながらクリックします)。すべての利用可能なフィールドの要約(上のチェックボックス)を表示することを選択した場合は、そのチェックボックスをオンにする前に回答フィルターを選択する必要があります。
- テキスト - テキストを入力することにより、自由回答形式などの質問の回答を検索することができます。文字列に部分一致するものを拾いたい場合は、ワイルドカードとしてパーセント記号(%)を使用します。例えば、'Tom%'で検索した場合、'Tomb'と'Tommy'などもヒットします。
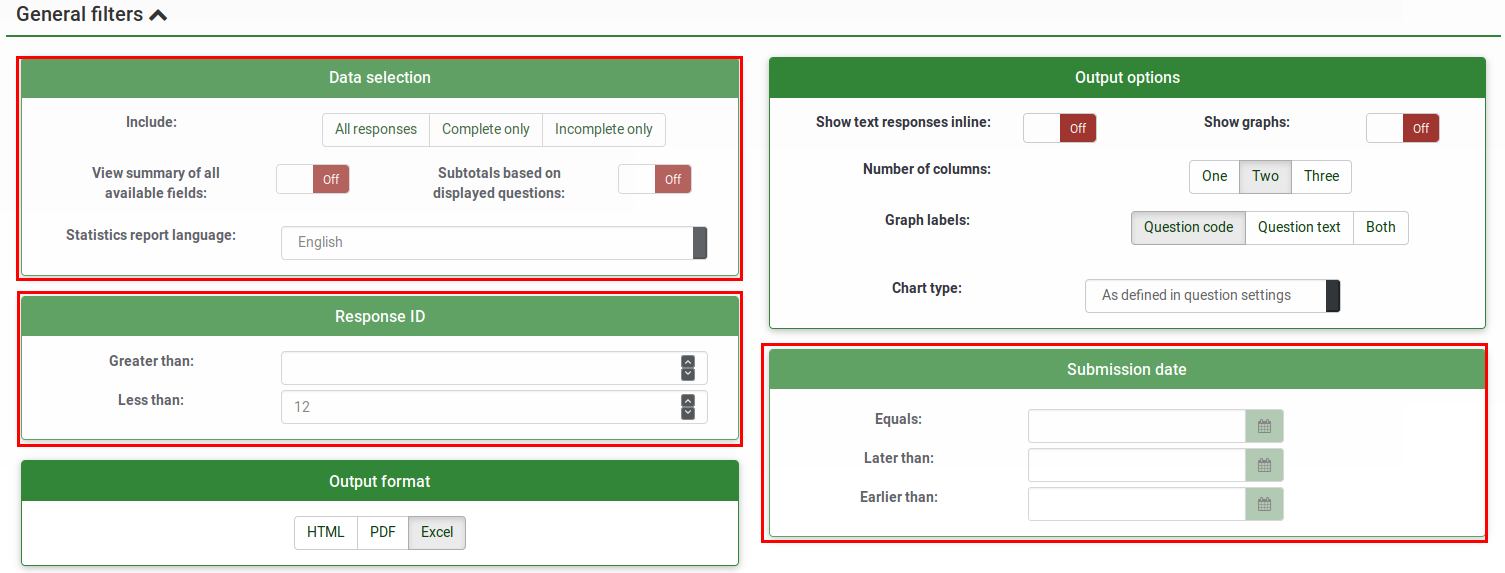
The filters can be related to:
- Data selection
- The type of responses:
- Complete responses: responses that contain a submission date
- Incomplete responses: answers that do not contain a submission date
- All records: the aggregated number of complete and incomplete responses.
- Statistics report language: if additional languages are used, this filter option is useful to divide respondents based on the language they used to fill out your survey.
- The type of responses:
- View summary of all available field: it is turned off by default. By enabling it, all the survey questions and groups will be taken into account when running the statistics script
- Subtotals based on displayed questions: it is deactivated by default. It counts stats for each question based only on the total number of responses for which the question was displayed (good way to filter the unfinished/incomplete responses).
- Response ID: use the ID number to filter your gathered responses
- Submission date: displayed only if timings is enabled. You can filter the data based on the submission date of your collected responses.
To get the answers filtered according only to the general filters, enable the "View summary of all available field" option and click on the View statistics button located in the upper-right part of the screen.
Response filters
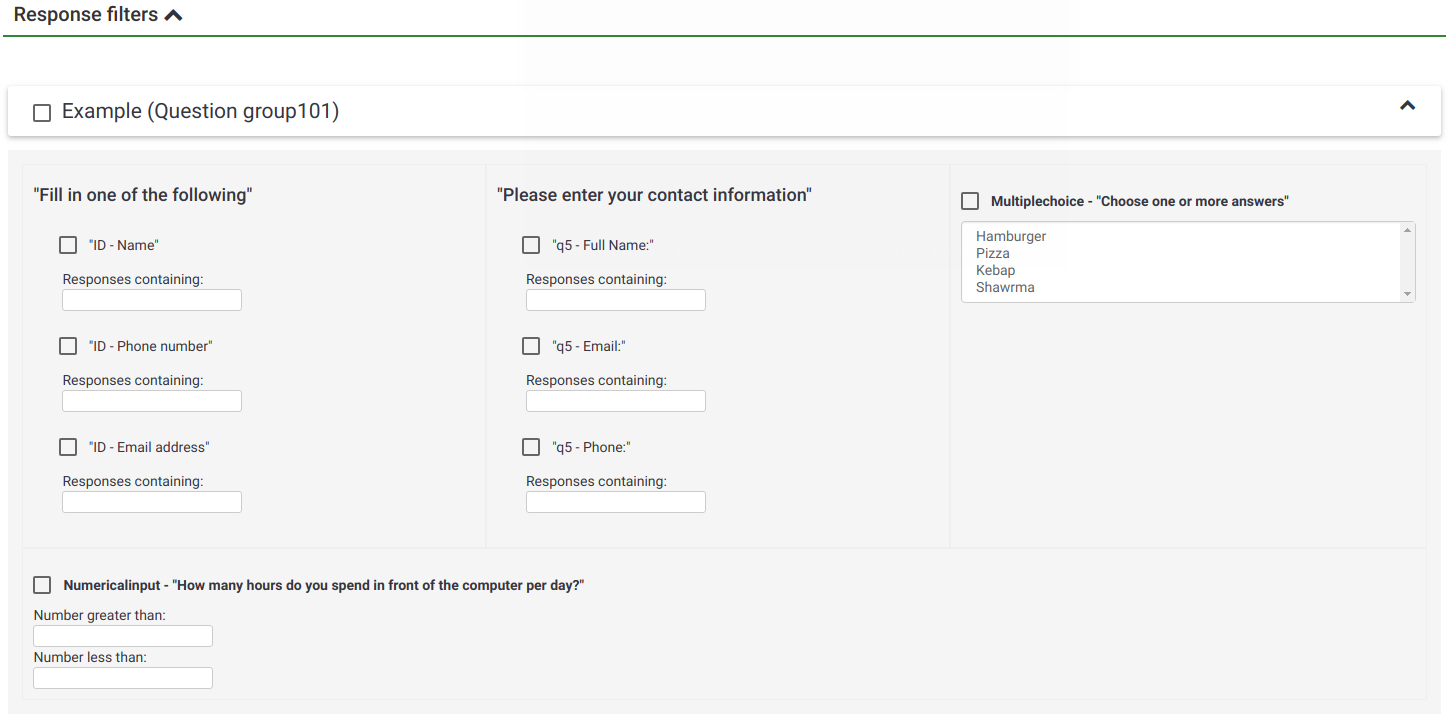
Depending on the used question type, different fields may be used to filter your answers:
- By response: click on one or more responses in the list under each question to filter the data by those responses (use CTRL/click to select multiple responses in the same question). Note that if you choose to view the summary of all available fields (checkbox at top) you will need to select your response filters before checking that box.
- By text: you can search the responses to a free text question type (and similar types) by entering a text. If you want to search for a partial string you can use the percentage sign (%) as wildcard. E.g.: If you look for 'Tom%', it will find entries with 'Tomb' and 'Tommy', etc.
- By numerical value: you can search the responses that contain a certain numerical value if number-based question types are used.
もし情報を集計したい質問自体に表示基準が設定されていると、基準に適合した回答だけが集計されます。ただしこのようにして作成した統計は混乱を招くことがあるので、集計する質問自身には基準を設定しないほうがお勧めです。
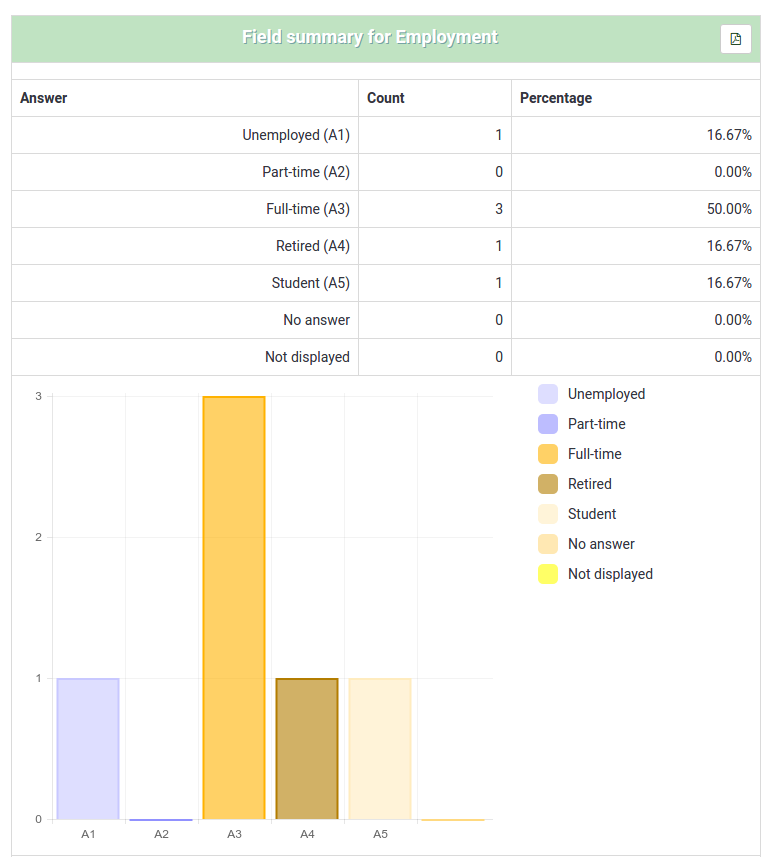
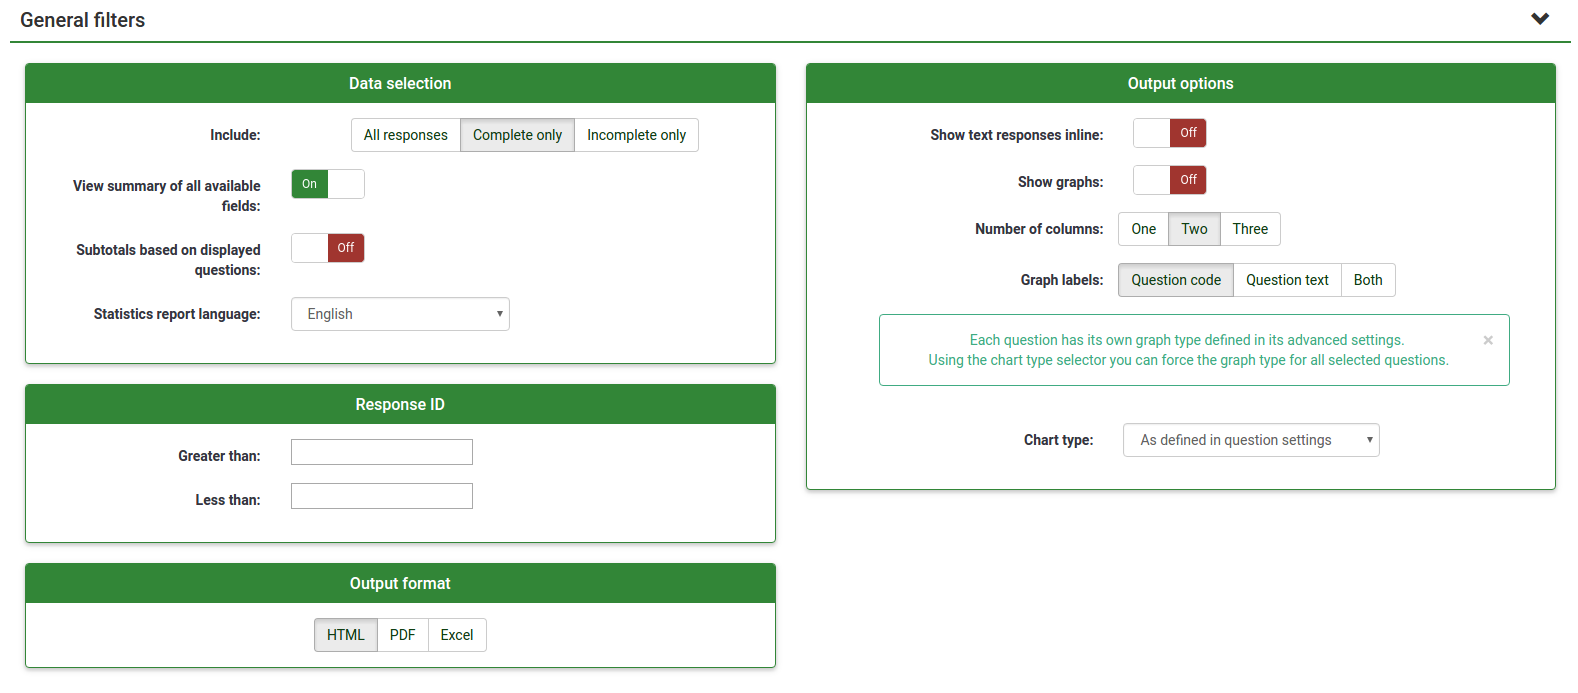
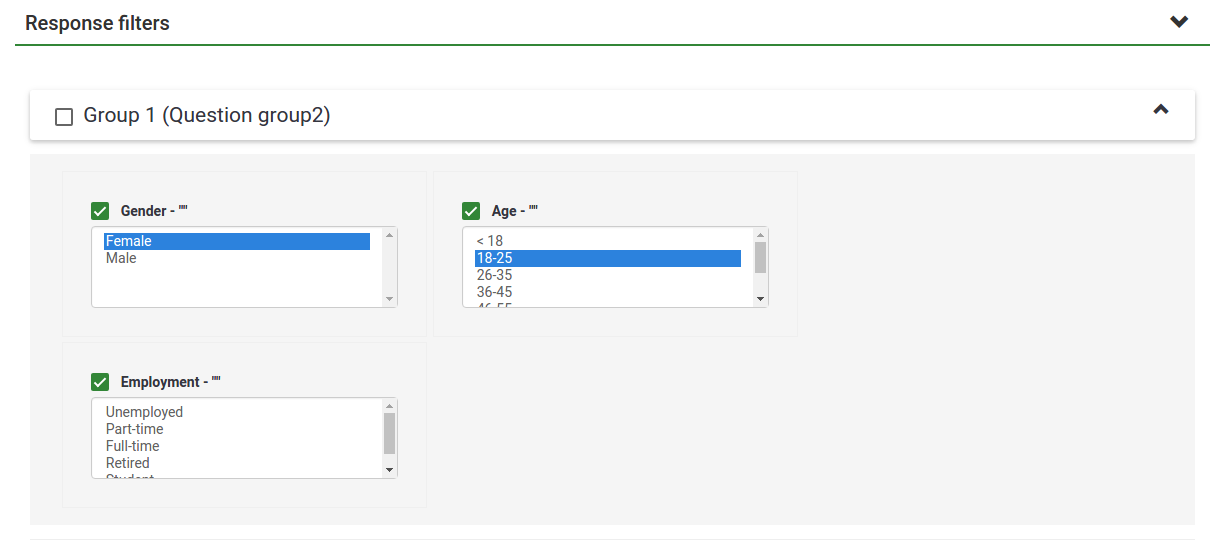
以下の画像は、回答完了/女性/年齢が18-25歳である回答者の"雇用状況"の統計を表示するための選択状態を示しています。13レコードのうち6レコードが抽出されています。
注意事項
- 概要を知ろうとしている質問に条件を設定した場合、その質問では条件に合った回答だけが表示されます。したがって、概要を知ろうとしている質問に基準を設定しないほうがよいでしょう。
- ひとつの質問で複数の項目を選択するには、CTRLボタンを押しながらクリックします。最後の項目の選択を解除するには(質問からすべての条件をクリアしたい場合)、CTRLボタンを押しながら強調表示された回答をクリックします。
グラフ
チャート作成には、pChartライブラリー(同梱、通常は設定不要)が使われます。
一旦グラフが作成されれば、更に簡単にグラフをエクスポートすることができます。画像の上で右クリックし、"名前を付けて画像を保存"を選択してグラフをpngファイルとして適当な場所に保存して下さい。ほとんどの集計に円グラフが表示されますが、"複数回答"の質問は棒グラフが表示されます。
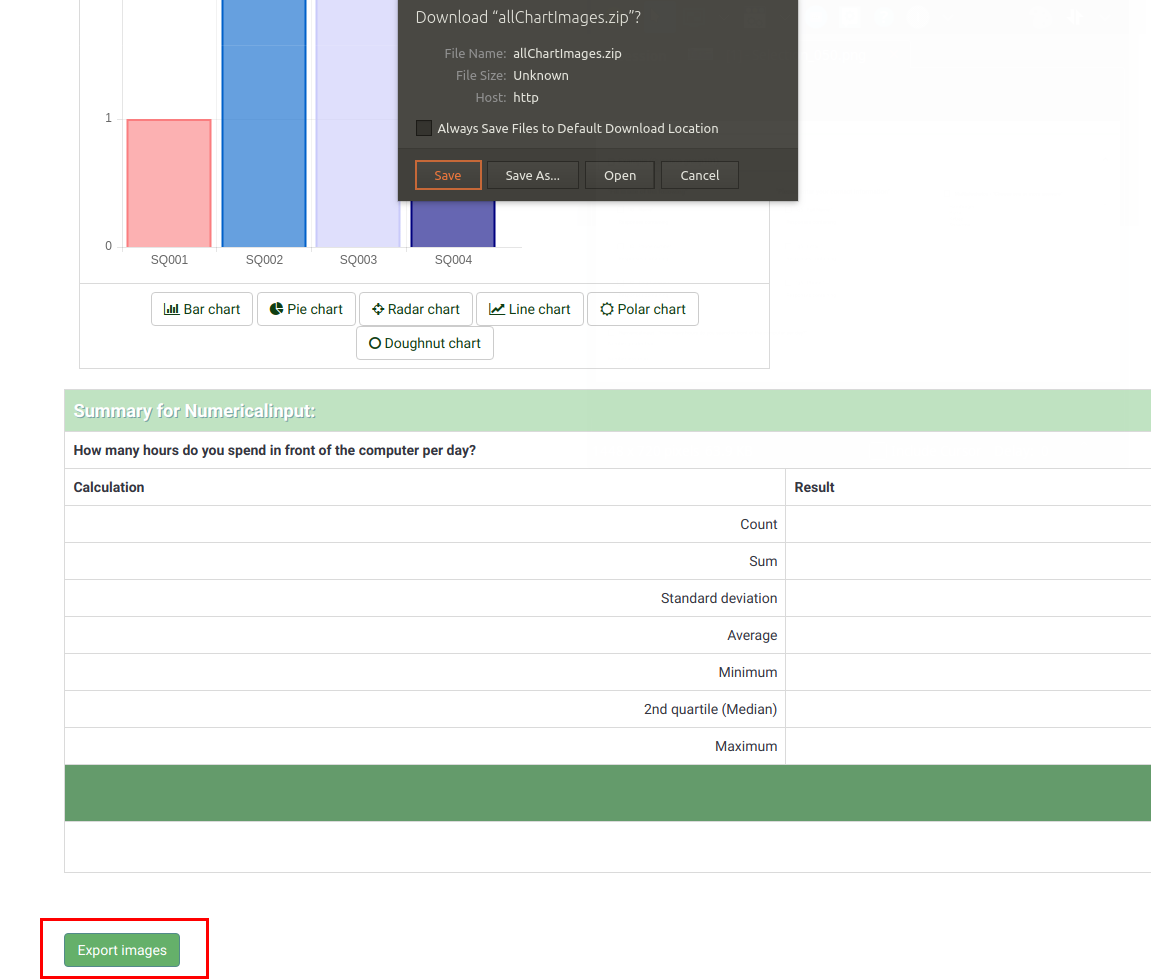
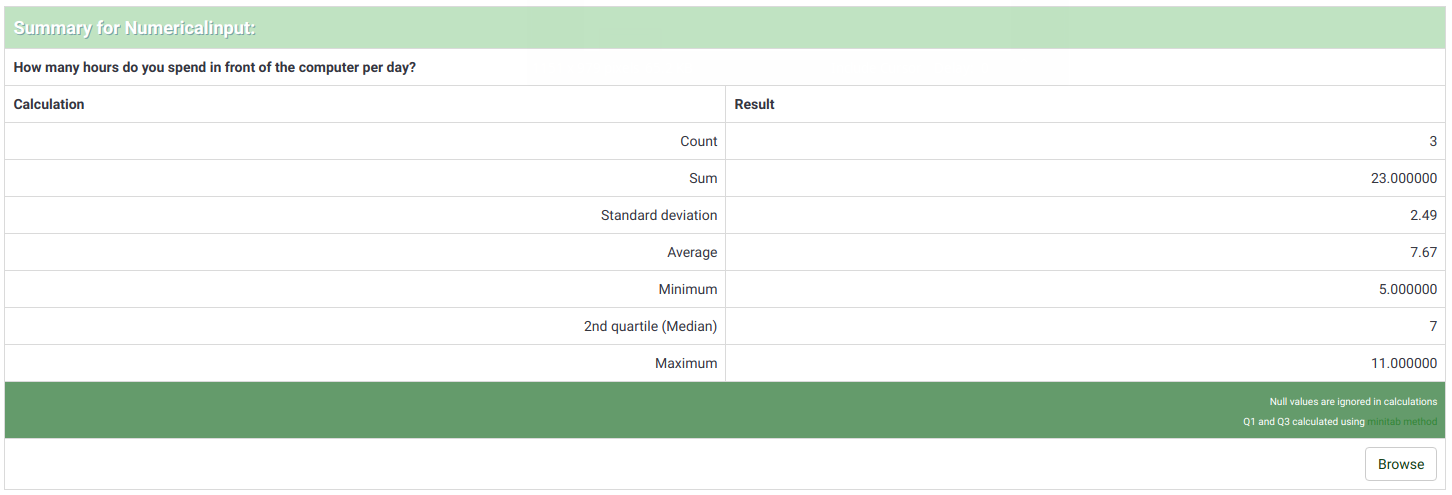
You can also use the "Export images" function to save all the graphs to your machine:
"未完了回答"、"わからない"と"未完了あるいは非表示"の件数
"未完了回答"件数:回答を開始したが、完了していないものの件数です。回答は参加者が調査の"次へ"ボタンをクリックすることで開始されていますが、最後の"投稿する"ボタンが押されていない状態です。
技術的には、入力に対するレコードが回答テーブルに作成されているが、投稿日はセットされていないという場合です。
"わからない"件数:質問は表示されたが参加者が回答しなかった場合です。
技術的には、必須ではない質問が表示され回答がないまま"次へ"や"投稿する"がクリックされた場合で、データベースには""(空文字列)がセットされます。この"わからない"はデータベース上で文字列で記録されない日付型や数値型には発生しません。
"未完了あるいは非表示"件数:表示されなかった質問がある場合です。これは質問の条件設定や、参加者がページが表示される前に"次へ"ボタンを押した場合に発生します。
技術的には、この質問に対してデータベースにはNULLが記録されます。
Output format and options
The statistics can be displayed under three different formats:
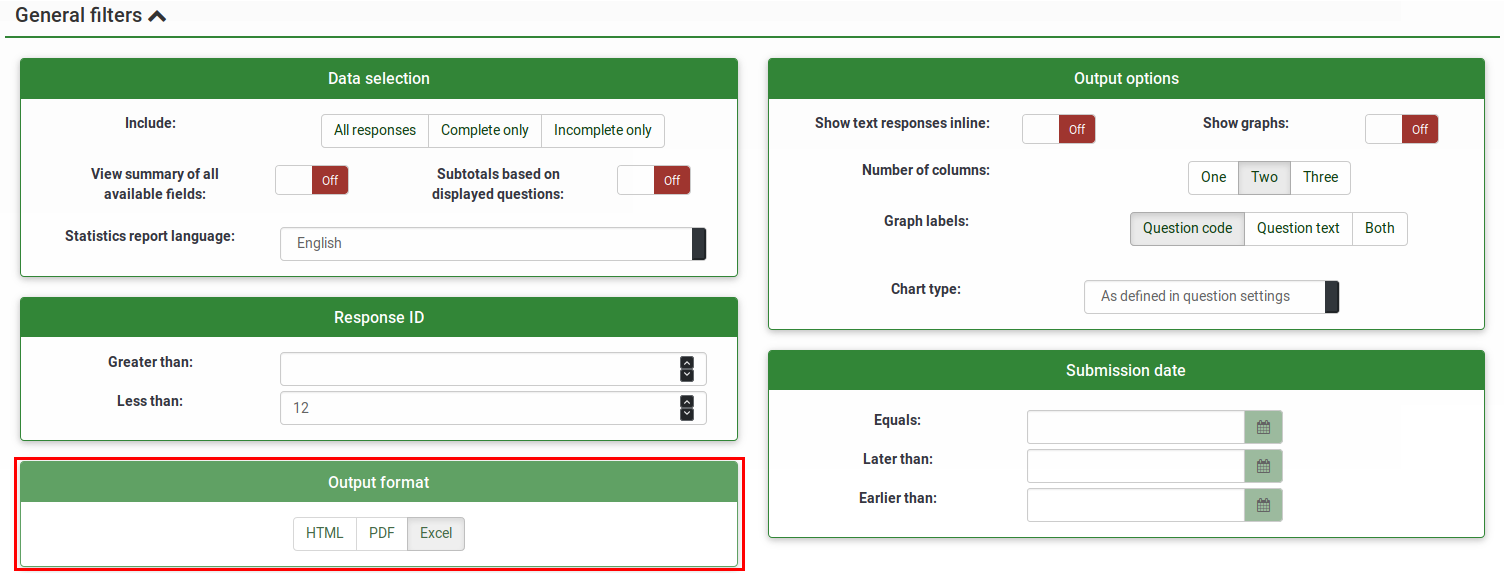
- HTML (default option): the statistics are displayed in LimeSurvey
- PDF: a popup will be displayed, asking to save the statistics as a PDF file
- Excel: To further work with your (filtered) data, choose Excel. You can export the file from a spreadsheet application to CSV to work with more advanced statistical tools such as SPSS or R.
The output options can be used to alter the way in which the statistics are displayed. The following options are available:
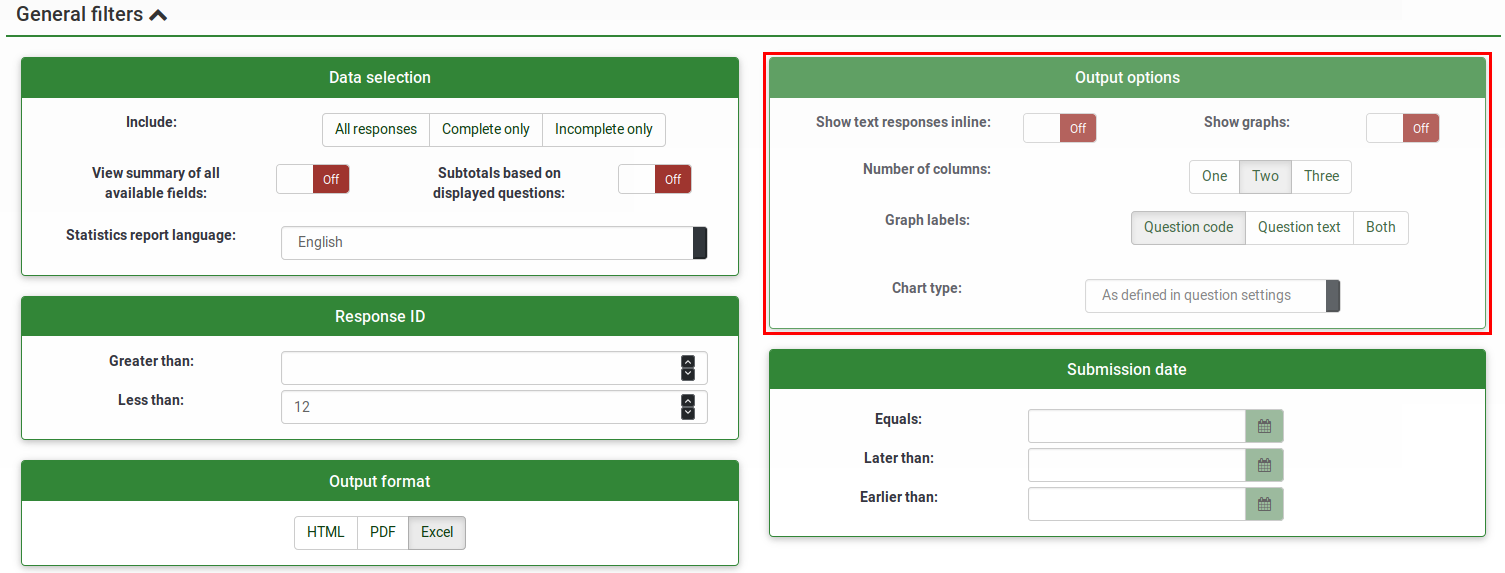
- Show text responses inline: it is disabled by default. It shows the text questions responses without having to click on a browse button (if enabled; useful for the HTML version of output format)
- Show graphs: it is disabled by default. If enabled, graphs will be displayed
- Number of columns: two is the default number. If you wish to have statistics and graphs displayed on only one or three columns, choose the desired value from this option. It applies to HTML statistics.
- Graph labels: choose how the label should look like in the graph.
- Question code
- Question text
- Both
- Chart type: the following chart type settings are available:
- As defined in question settings: useful if you wish the graph not to be displayed. If this is the case, deactivate it from the question settings and select from the "Statistics" panel this option.
- Bar chart
- Pie chart
- Radar chart
- Line chart
- Polar chart
- Doughnut chart
Statistics - simple mode
The simple mode was created in order to provide simple bar chart statistics that can be quickly exported and saved, and then included into a presentation:
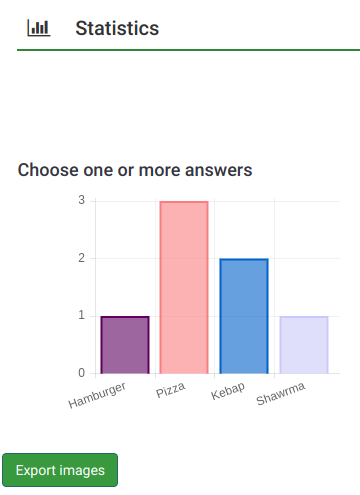
As you can observe, fewer graphs are displayed than in the expert mode. While in the export mode you can display graphs with respect to those who filled out the survey, did not answer it or did not finish completing it, the simple mode displays only statistics that rely on the "countable" data submitted by the respondents (e.g., single or multiple choice questions as well as array questions).
There is only one option to filter the data within the simple mode - via the responses to be included in the statistics. As a result, the statistics may include the complete responses, incomplete responses, or all responses (the aggregated sum of the first two options). This option is located in the upper-right part of the panel.
To switch back to expert mode, look for the "Expert mode" button located in the upper-right part of the screen:

統計の公開
LimeSurveyには簡単な統計を参加者に公開する機能があります。参加者はオンラインで調査をすべて入力した後にそれを見ることができます。
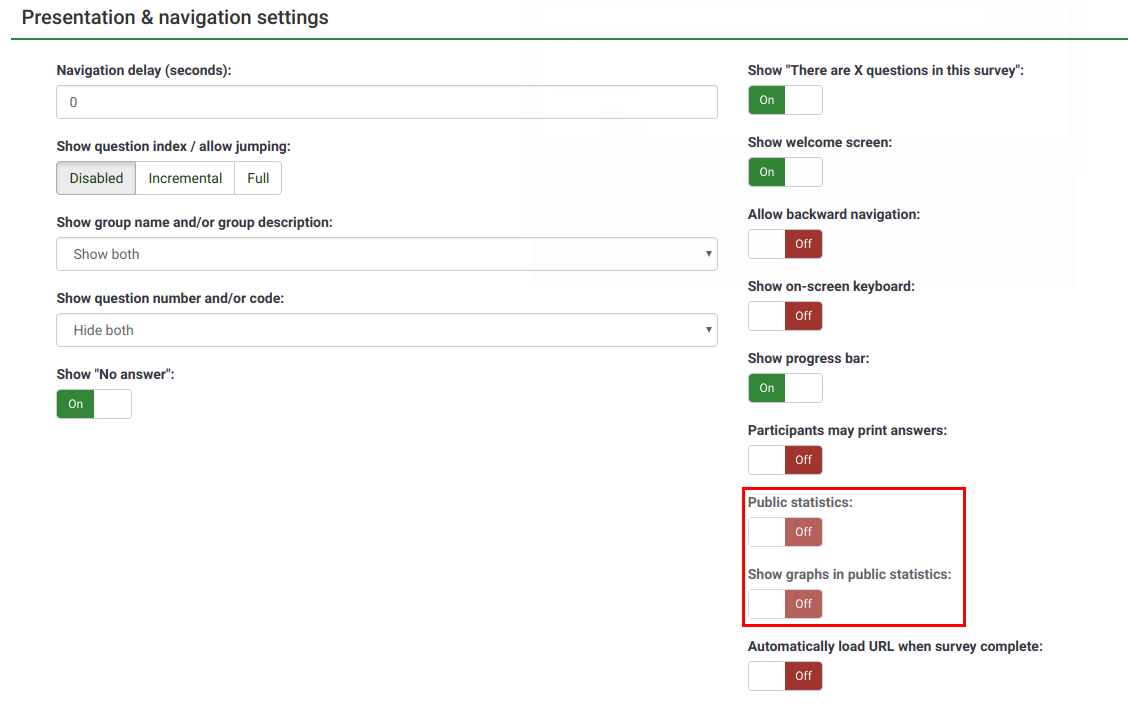
参加者に統計を見せるには、2つのステップが必要です。まず、アンケートの統計公開を有効にする必要があります(デフォルトではオフになっています)。この設定は、プレゼンテーション&ナビゲーションタブメインのアンケートツールバーにある一般設定で行います。"統計公開"の設定を探します。ここでは、"公開統計でグラフを表示"という設定もあります。オンの場合、グラフとカウントが表示されます(デフォルトでは数値統計のみが表示されます)。
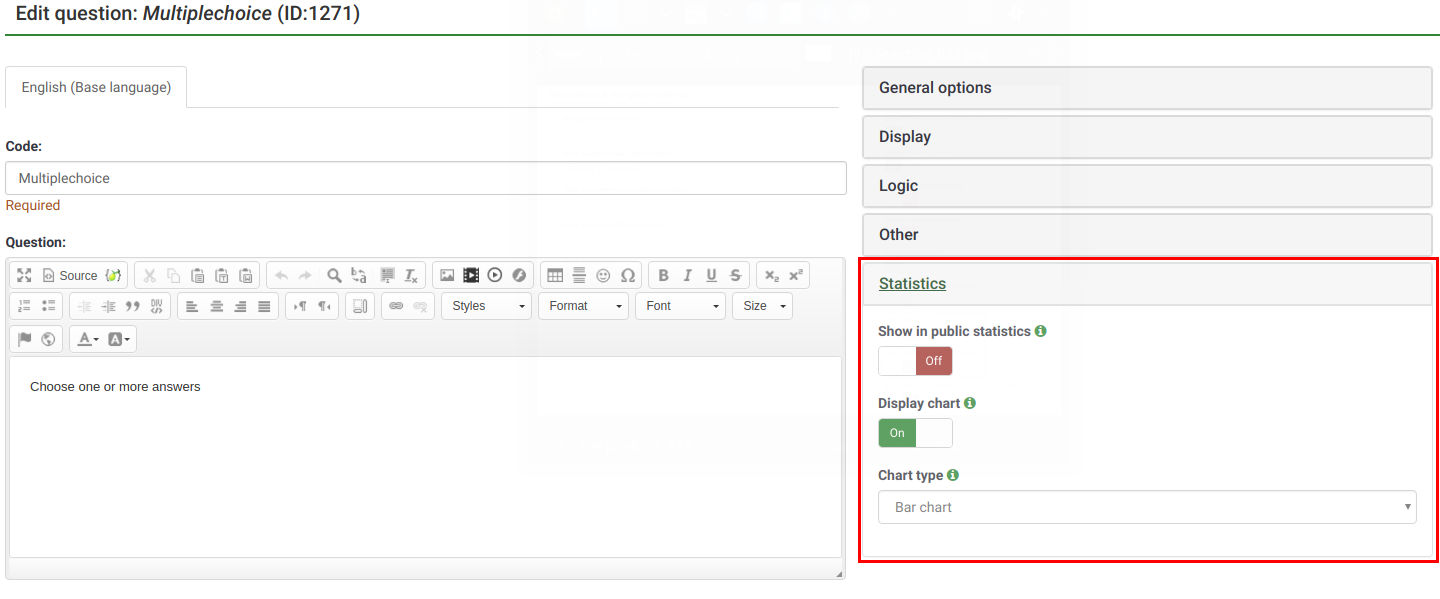
各質問を編集し、統計公開ページにどの質問を表示するか設定します。各質問の統計タブには、"公開統計に表示"オプションがあります。この設定を"オン"にすると、質問が統計公開ページに表示されます。
参加者に見えるもの
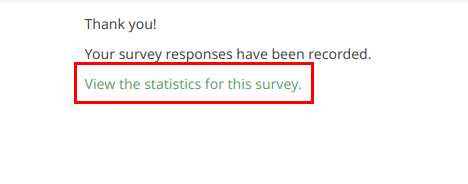
統計公開を有効にして表示する質問を選択すると、アンケート完了時に追加のオプションが参加者に示されます。通常のお礼メッセージに加えて、"このアンケートの統計を閲覧"というリンクがあります。
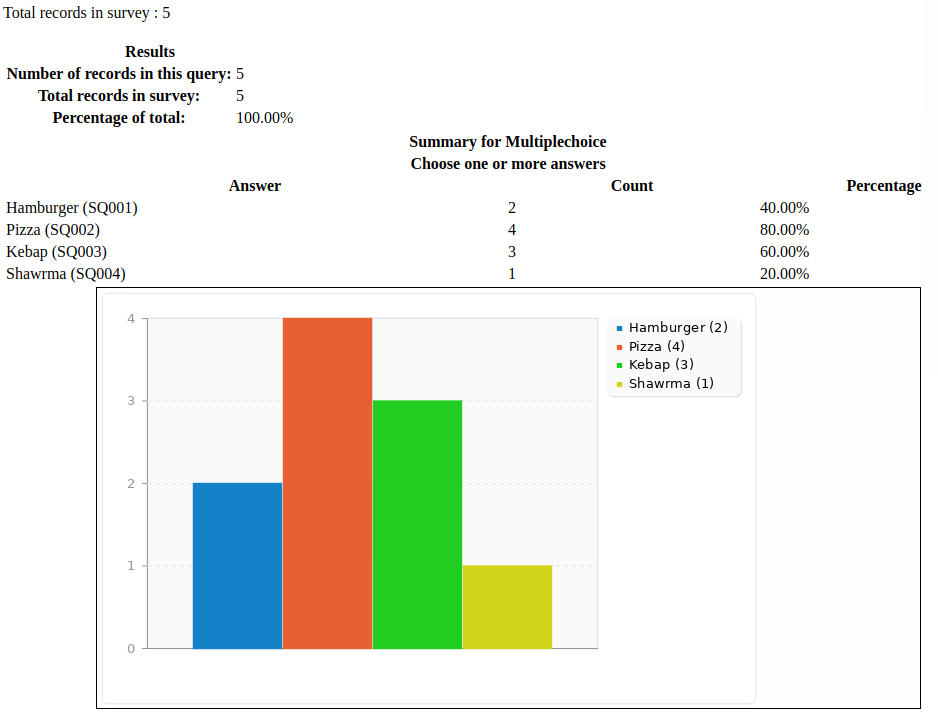
参加者がこのリンクをクリックすると、あらかじめ選択した質問に対する回答の詳細とグラフ(グラフ表示を選択した場合)を含むページを見ることができます。
統計公開ページの見た目を変更する
統計公開ページの外観は、template.css("#statsContainer"で検索)で変更できます。ただし、現在のところ、Limesurveyテンプレートエディターでは編集できません。
Hints & tips
Feel free to edit the following wiki sections to let other LimeSurvey users learn about statistics-related hints & tips.
Wrong font when exporting statistics. What to do?
しかし、いくつかの言語(例:中国語)で通常使われているフォント(Vera)には必要な文字セットが含まれていません。そのような場合は config.phpの$chartfontfile に新しくTTFフォントを設定して下さい。(config-defaults.phpを確認して正しく設定して下さい) 中国語(簡体字・繁体字)の場合はFireFlySungフォントを推奨しています。以下からダウンロードできます[1]。
FAQs
5 point choice question type - what do the values located under the "Sum" column represent?
As it can be observed in the below screenshot, the "Sum" column shows the aggregated values in the following way:
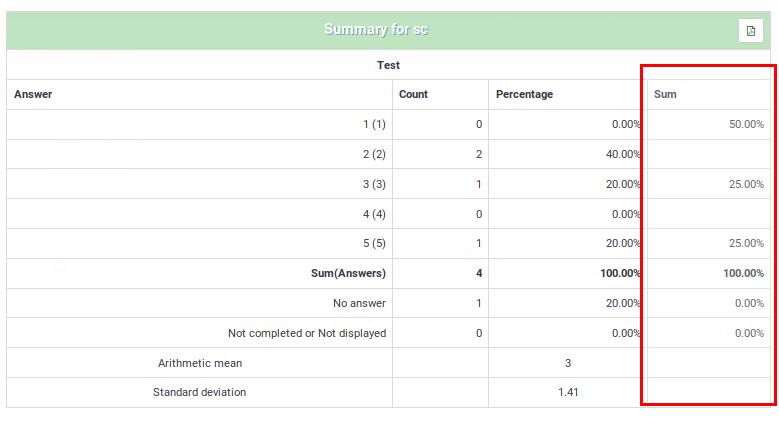
The grouping from the "Sum" column was done in this way because, when rating questions, survey administrators usually interpret the results in this way:
- Y percent of the respondents DISLIKE item ABC, where Y represents the percentage of those who answered "1" and "2"
- X percent of the respondents LIKE item ABC, where X represents the percentage of those who answered "4" and "5"
- Z percent of the respondents have a NEUTRAL opinion about item ABC, where Z represents the percentage of those who answered "3"
| Answer | Count | Sum |
|---|---|---|
| 1 | 0 | 50% (the percentage of those who answered "1" and "2") |
| 2 | 2 | |
| 3 | 1 | 25% (the percentage of those who selected "3" - the neutral option) |
| 4 | 0 | |
| 5 | 1 | 25% (the sum of those who answered "4" and "5") |
| Sum (Answers) | 4 | 100% |
| No answer | 1 | 0% (always "0%") |
| Not completed or displayed | 0 | 0% (always "0%") |
