统计
From LimeSurvey Manual
常规
统计功能通过位于最后的下列列表菜单反馈下的菜单来调用 "反馈和统计" (仅在调查处于活动状态可用):

找到位于顶部工具栏上的统计按钮,并点击:

下面的页面将会被载入:

LimeSurvey 的统计以 专家模式 或 简单模式来呈现。点击 统计 按钮后默认显示专家模式 。
统计 - 专家模式
假定你正在运行一份调查,或者已经完成并打算开始分析调查结果。LimeSurvey 能够将所有结果转存到 Excel 电子表格或 CSV 文件中。你可以对相关的文件做任何操作。或者你也可以利用统计功能看看调查结果,并从中获得有用的信息。
统计 - 专家模式允许你对数据进行 '筛选' ,从中检索不同字段的数据和汇总。 统计脚本不会做过于复杂的筛选,但你会对唾手可得的有序信息感到意外。
运行快速统计
看下图能发现,每一个问题都有一个复选框,用来显示每个被选中问题的反馈摘要。还有一个图标,(或者鼠标在上面悬停的话),点击的时候会显示问题的完整文本信息。要查看一个或多个问题的反馈结果,点击问题上方的复选框,然后再点击 "查看统计"。
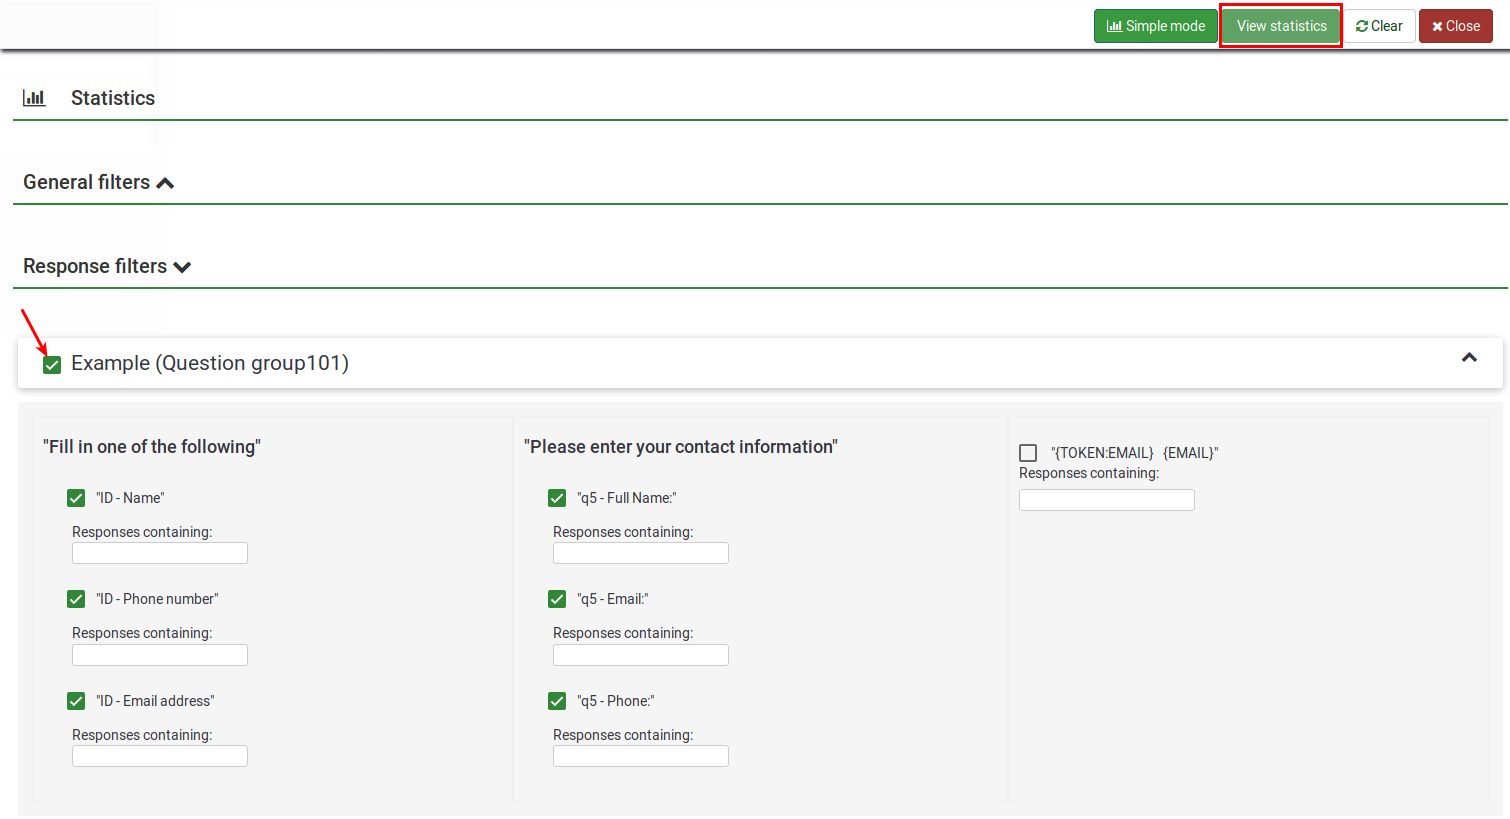
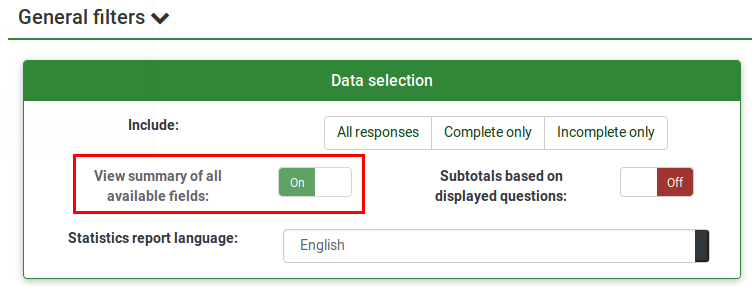
或者,要查看所有问题的反馈结果,启用 "查看所有可用的字段的概要" 然后点击"查看统计":
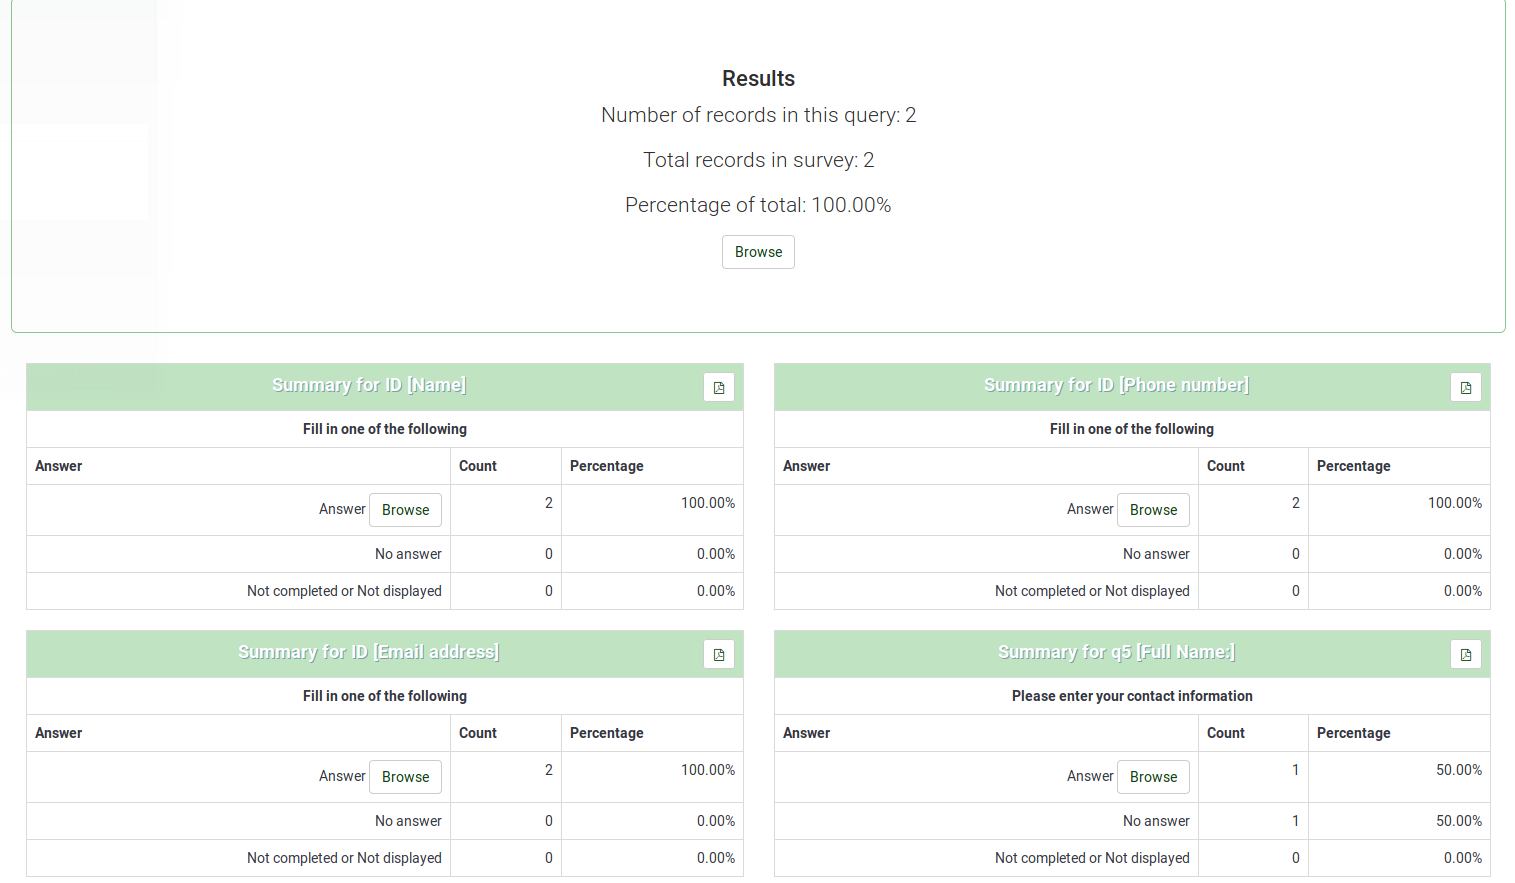
你会得到一份显示调查数量的 "结果" 表格,还有一份为每个选定问题提供的"字段摘要" 表格,总结问题中所有可能的答案,总数,还有相应的百分比。
数据过滤
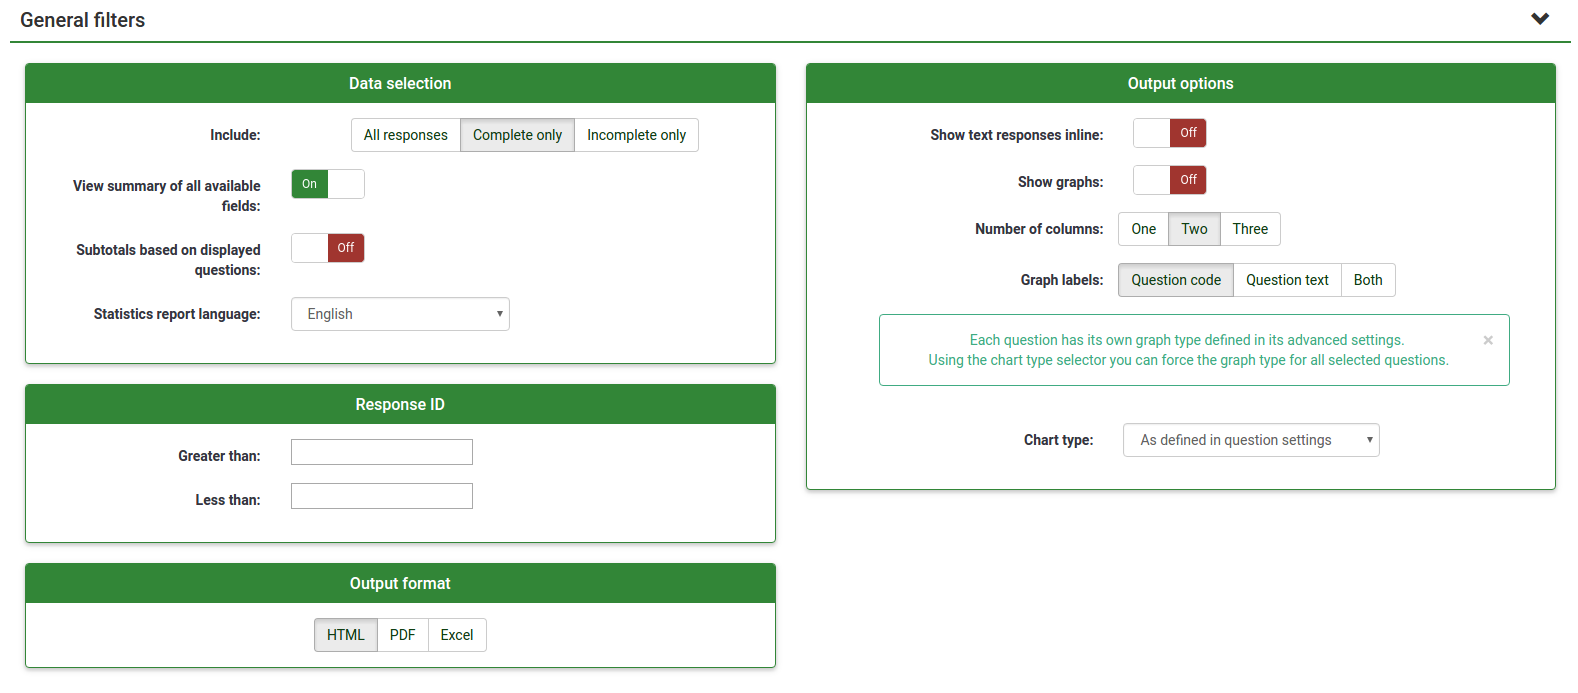
常规过滤
顾名思义,它是指一般(宏)级别的过滤器:
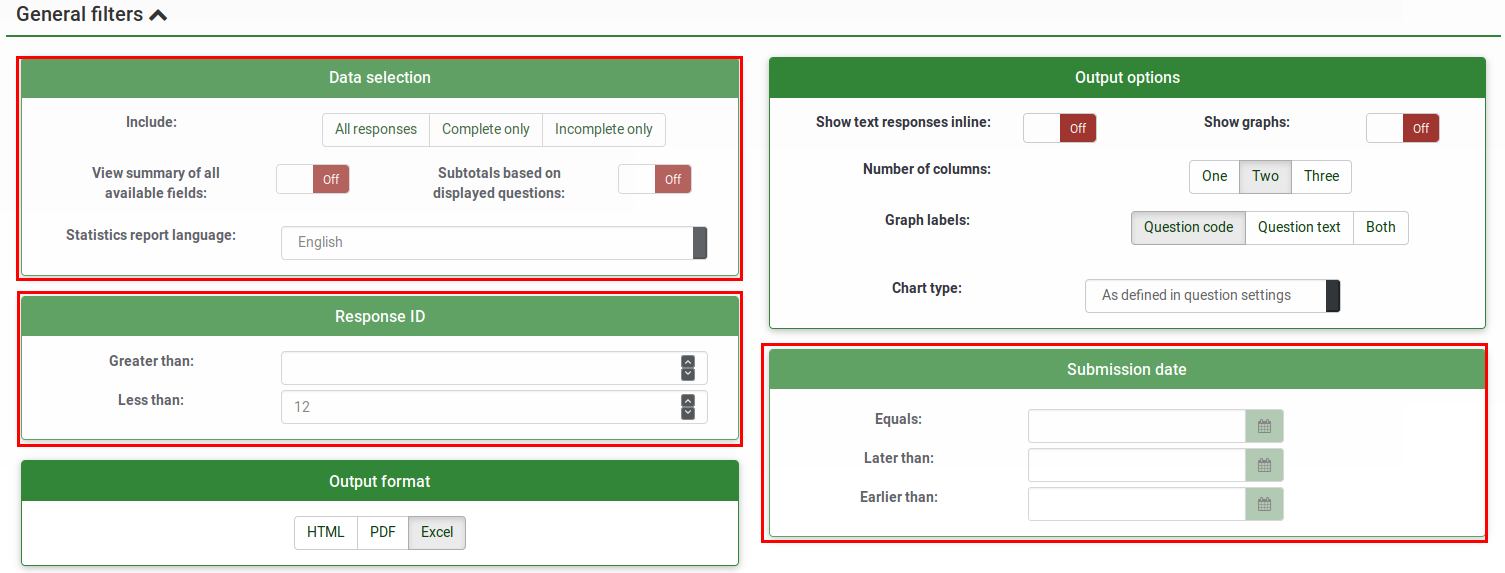
筛选器可以与以下内容相关:
- 数据选择
- 反馈类型:
- 完整反馈: 包含提交日期的反馈
- 不完整反馈: 答案没有提交日期
- 所有记录: 完整和不完整反馈的合计数。
- 统计报告,语言: 如果使用其他语言,则此过滤器选项可用于根据受访者填写调查表所使用的语言对受访者进行划分。
- 反馈类型:
- 查看所有可用字段的摘要: 默认关闭。启用后,在运行统计脚本的时候将考虑所有调查的问题和组。
- 按显示问题小计: 默认关闭。它仅基于显示该问题的反馈总数来统计每个问题的统计信息 (过滤 未完成/不完整 反馈的好方法).
- 反馈 ID: 使用 ID 的数字过滤生成的反馈
- 提交时间: 仅在 计时启用 显示。可以基于收集到的反馈的提交时间来过滤数据。
要想得到仅针对 常规过滤 的过滤结果,启用 "查看所有可用字段的摘要" 选项,并点击位于屏幕右上端的 查看统计 按钮。
反馈过滤器
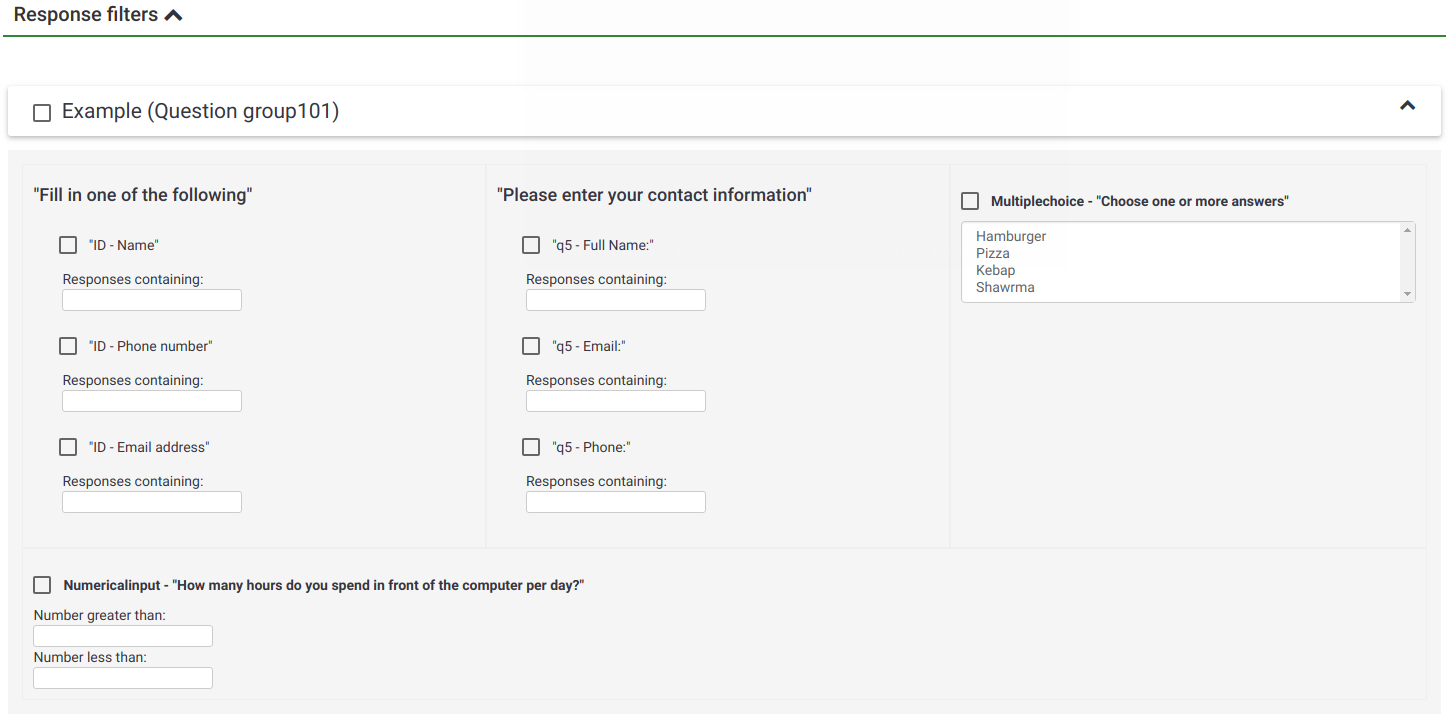
依据使用的 问题类型 不同,会使用不同的字段过滤答案:
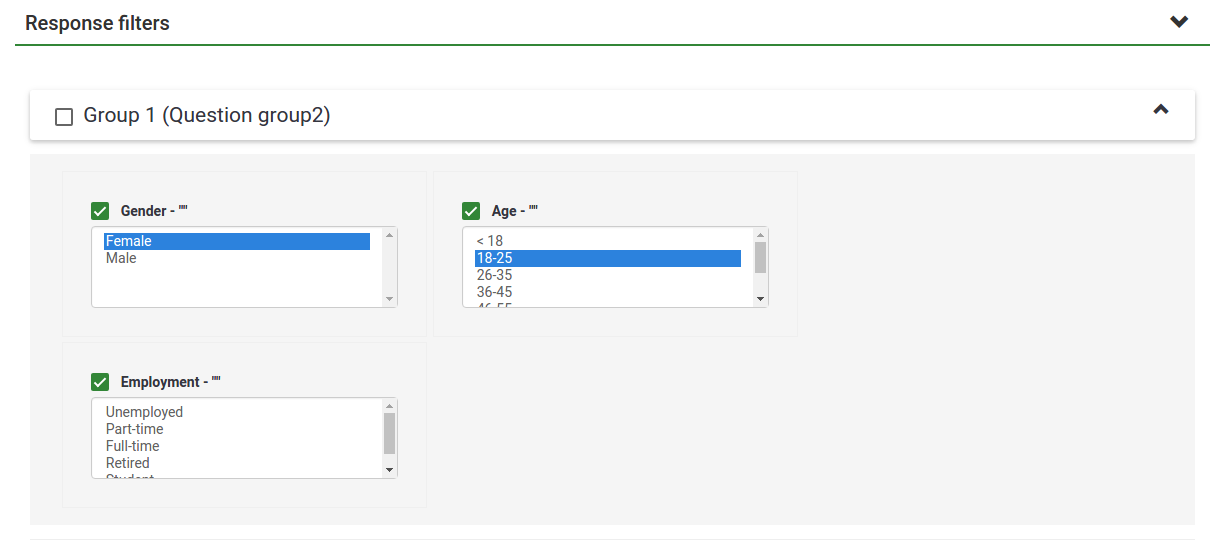
- 按反馈: 点击每个问题下方列表中的一个或多个反馈,使用这些反馈过滤数据 (按住 CTRL 可以多选在同一个问题下的反馈)。注意,如果要使用查看所有可用字段的摘要 (顶部的复选框),你需要在选中复选框前选择反馈过滤器。
- 按文本: 可以通过输入文本来查找简单文本问题类型(或类似类型)的反馈。如果要如果要搜索部分字符串,可以使用百分号(%)作为通配符。例如:如果要查找 'Tom%',会找到有 'Tomb' 和 'Tommy' 等的条目。
- 按数值: 如果使用了基于数字的问题类型,可以搜索包含特定数值的反馈。
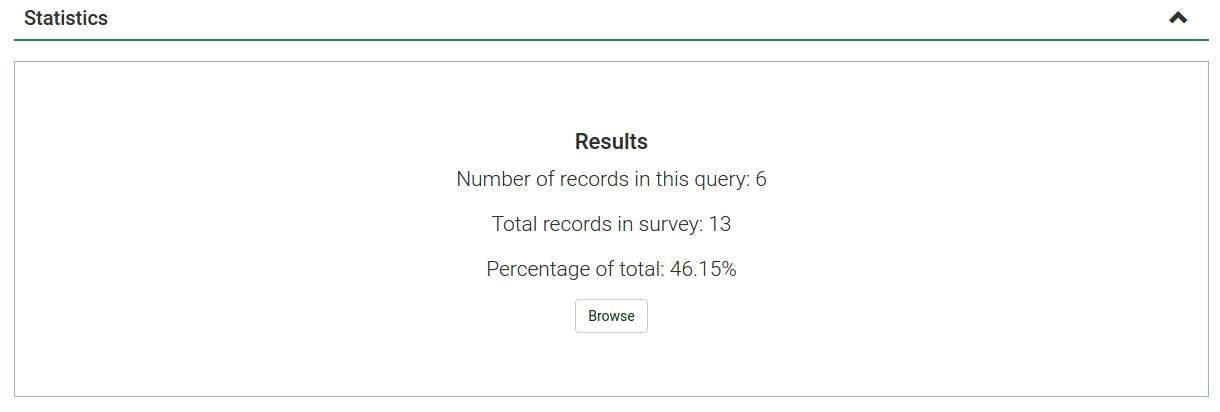
选择 "查看统计" 将会提供 "结果" 表格,说明符合你条件的反馈的数量,还有一份为每个选定问题提供的"字段摘要" 表格,总结问题中所有可能的答案,总数,还有相应的百分比。要注意的是,这些结果都是全部反馈的子集。因此,举例来说,如果你的条件是显示180条中记录中的146条,摘要就会只显示表中146条记录的详细。
下图显示我选择查看 完整记录/女性/年龄 18-25 的 "就业状况"。给出的结果是13条记录中的6条。
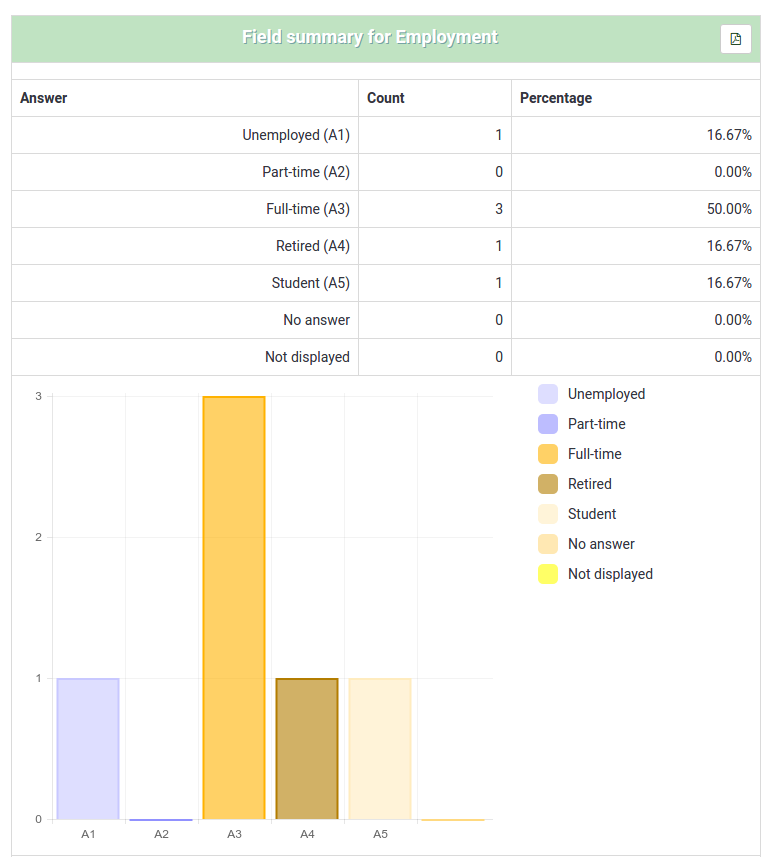
- 如果你在同一个问题上设置条件来获取摘要,那么结果就只会展示符合你条件的答案内容。所以最佳实践是 不 要在你要获取摘要的同一个问题上设置任何条件。
- 要选择一个问题的多个条目,按住 CTRL 键的同时点击选择。要 "取消选择" 最后的条件(如果你清空一个问题上的所有条件),按住CTRL 键的同时点击相应的突出显示的问题。
图表
对于图表,已经使用,并完全包含了pChart 库,通常不需要做任何配置。
图表被创建之后,你可以很容易导出这些图表。右键点击图表,并选择 "图片另存为",然后图片将会以 .png 格式保存在你选定的位置。
你也可以使用 "导出图片" 功能将所有图片保存到你的计算机:
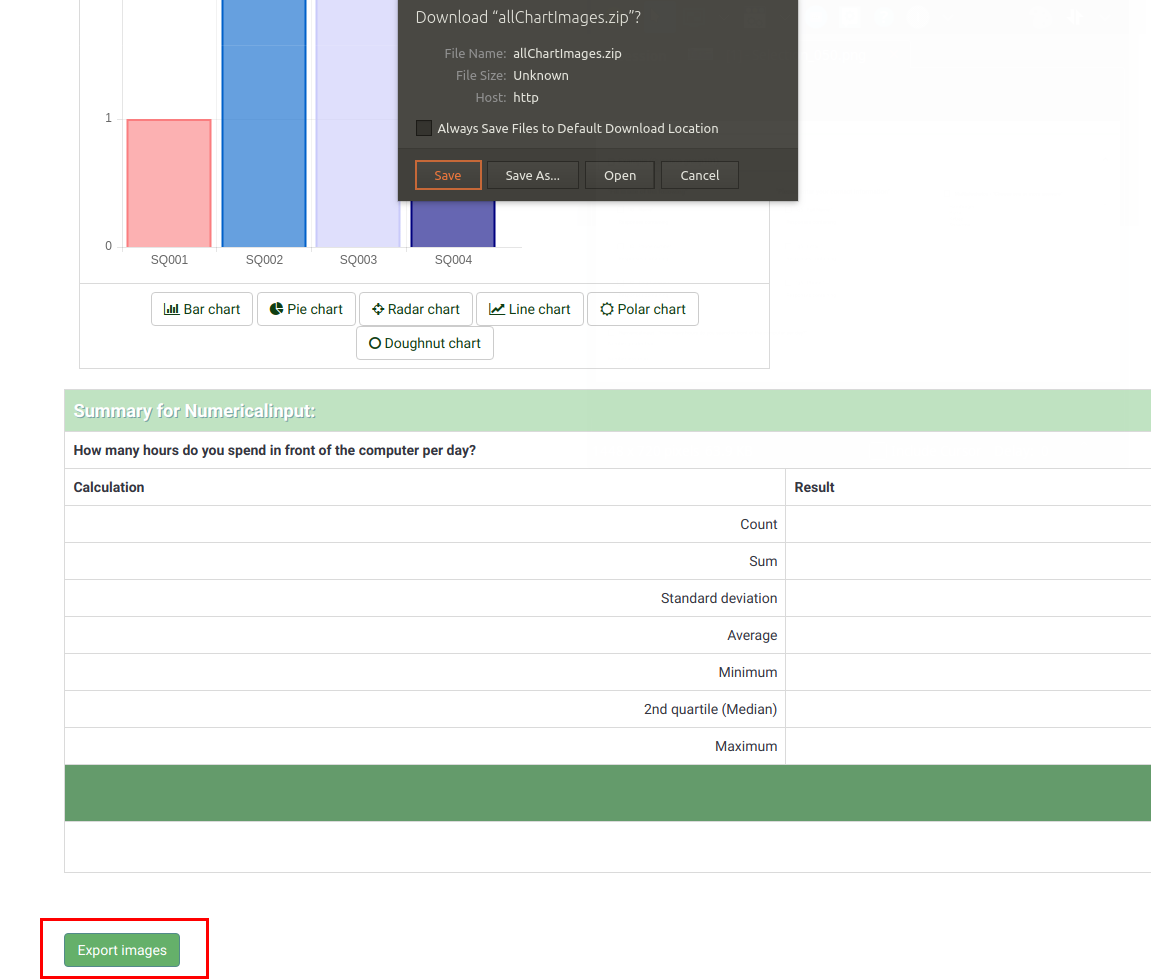
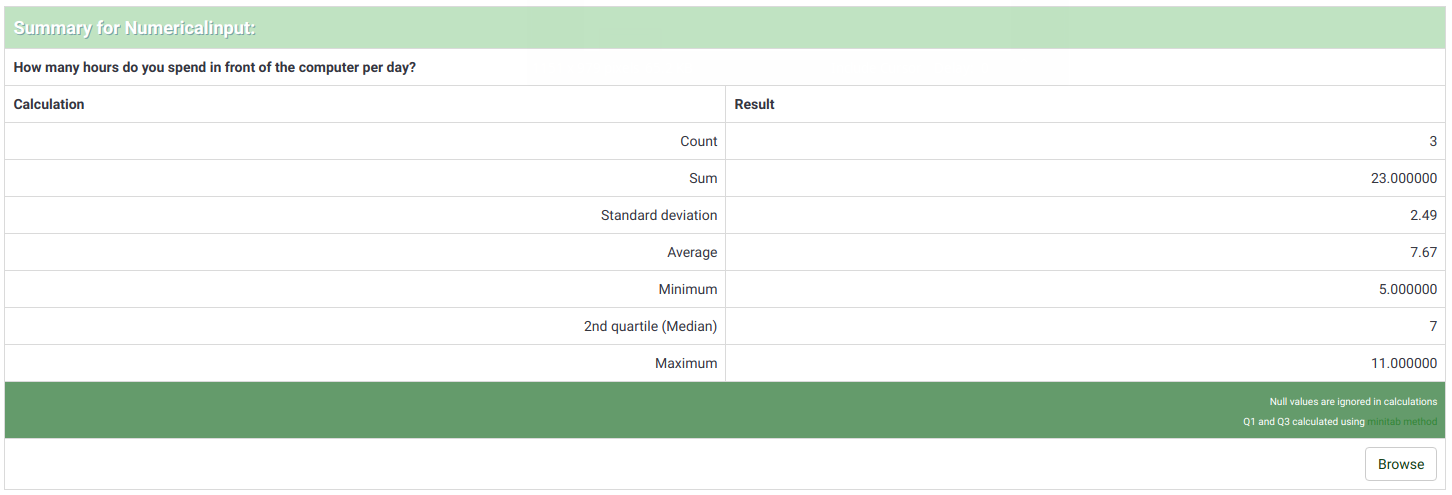
"不完整反馈", "无答案" 和 "未完成/未显示" 计数
- 不完整反馈:所有的反馈都已开始由受访者填写完毕,但并不完整。一份反馈由参与者在调查中点击 "下一步" 按钮开始,但最后却没有点击 "提交" 按钮(没有浏览到调查的最后一页)。
从技术角度来说,当新的数据集创建之后,反馈表 中该条目却没有提交日期。
- 无答案:问题显示之后,参与者没有给出答案。
从技术上说,非必填项问题显示之后没有接收到答案,用户点击了 "下一步" 或是 "提交"。结果就是数据库字段将这个问题的答案设置成 "" (空字符串)。对于数据库字段无法保存字符串的日期或纯数字问题,无法真正计算这种无答案状态。
- 未完成/未显示:当页面包含没有被显示的问题。可能是条件所致,或着只是参与者在页面显示完之前退出了调查(或者页面显示完成,但没有点击下一步按钮)。
技术上说,这个问题的数据库字段被填充为空值(NULL)。
输出格式和选项
统计数据可以用3种不同的格式显示:
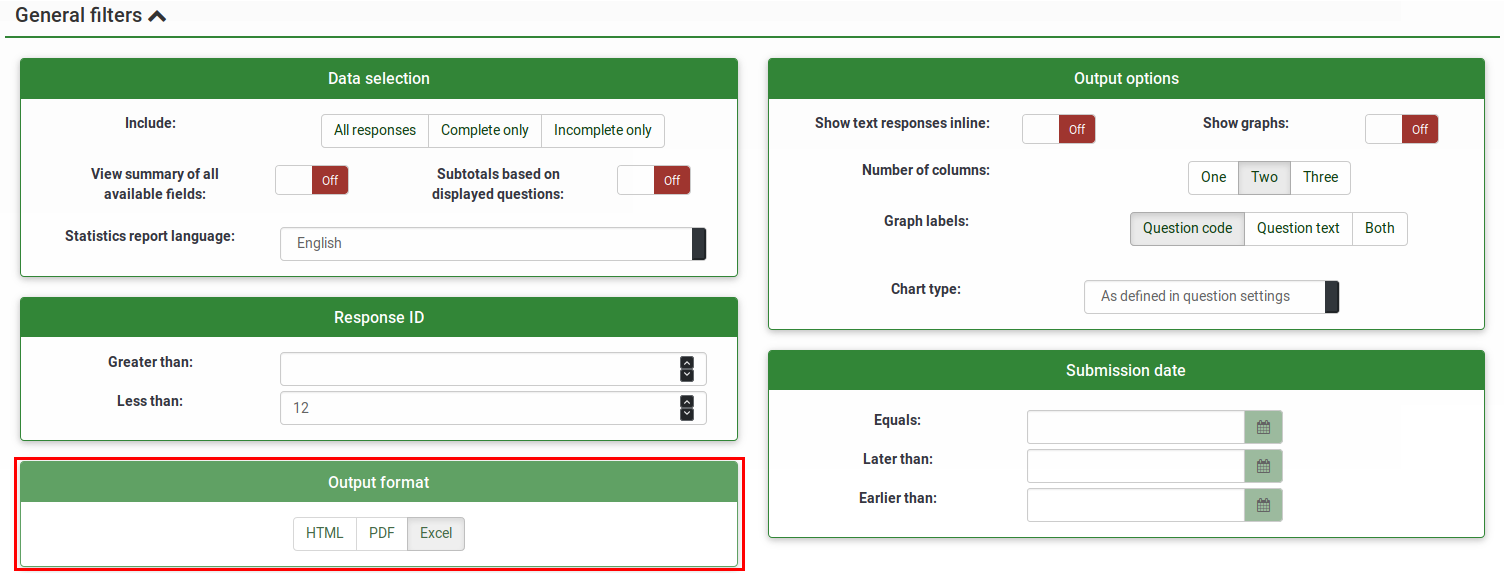
- HTML (默认选项):在 LimeSurvey 页面显示统计信息
- PDF:将显示一个弹出窗口,要求将统计信息另存为PDF文件
- Excel:要想进一步的处理统计数据(过滤后的),请选择 Excel。
也可以使用电子表格将文件导出为 CSV,为更高级的统计工具,如 SPSS 或 R 来使用。
The output options can be used to alter the way in which the statistics are displayed. The following options are available:
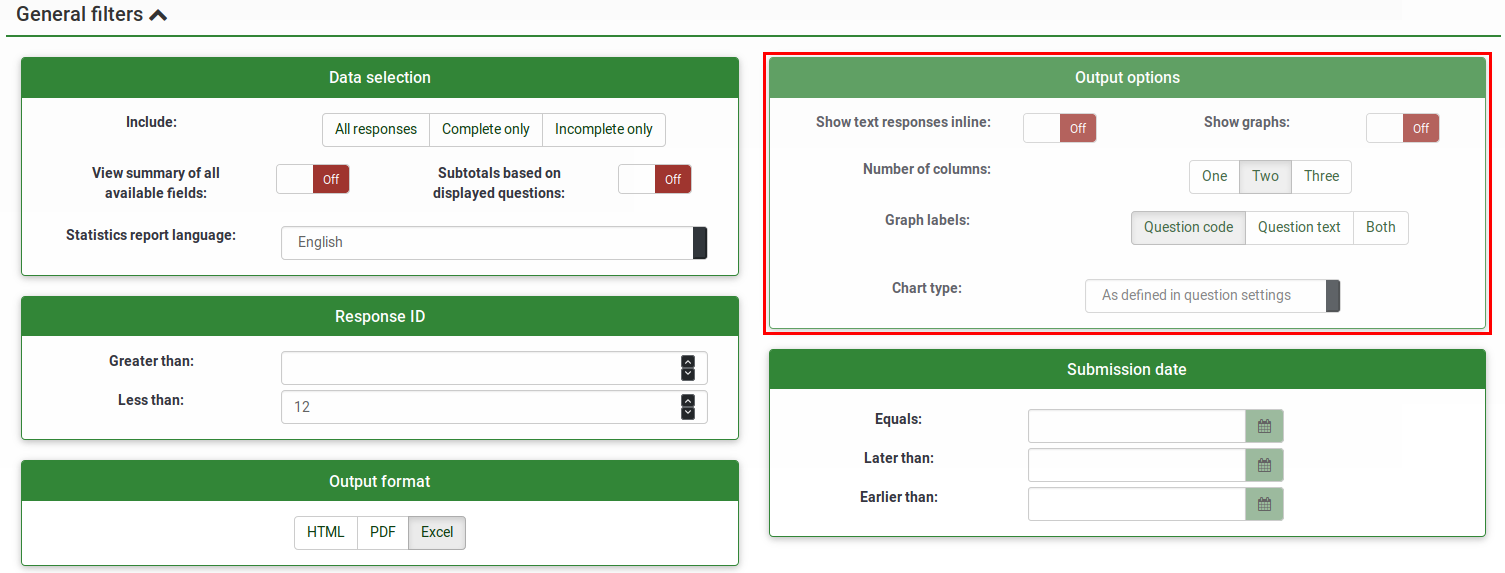
- Show text responses inline: it is disabled by default. It shows the text questions responses without having to click on a browse button (if enabled; useful for the HTML version of output format)
- Show graphs: it is disabled by default. If enabled, graphs will be displayed
- Number of columns: two is the default number. If you wish to have statistics and graphs displayed on only one or three columns, choose the desired value from this option. It applies to HTML statistics.
- Graph labels: choose how the label should look like in the graph.
- Question code
- Question text
- Both
- Chart type: the following chart type settings are available:
- As defined in question settings: useful if you wish the graph not to be displayed. If this is the case, deactivate it from the question settings and select from the "Statistics" panel this option.
- Bar chart
- Pie chart
- Radar chart
- Line chart
- Polar chart
- Doughnut chart
Embed custom logo at statistic PDF
(available for Limesurvey 3.x since 12/2018)
If you want to embed your own logo to the statistics PDF, then make sure a file named exactly "statistics.jpg" is placed within the "images" folder of the admin theme used for your system. Which admin theme is used can be set at the Global Settings.
Statistics - simple mode
The simple mode was created in order to provide simple bar chart statistics that can be quickly exported and saved, and then included into a presentation:
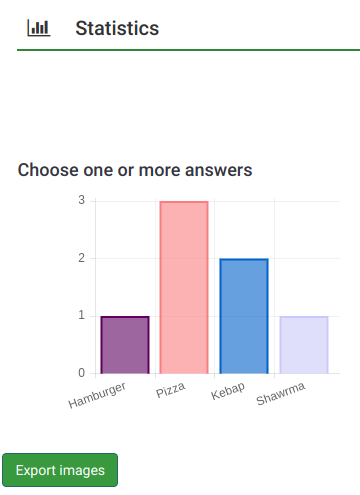
As you can observe, fewer graphs are displayed than in the expert mode. While in the export mode you can display graphs with respect to those who filled out the survey, did not answer it or did not finish completing it, the simple mode displays only statistics that rely on the "countable" data submitted by the respondents (e.g., single or multiple choice questions as well as array questions).
There is only one option to filter the data within the simple mode - via the responses to be included in the statistics. As a result, the statistics may include the complete responses, incomplete responses, or all responses (the aggregated sum of the first two options). This option is located in the upper-right part of the panel.
To switch back to expert mode, look for the "Expert mode" button located in the upper-right part of the screen:

Public Statistics
LimeSurvey includes the functionality to display simple statistics to the general public or to your participants after they have ended filling out an online survey.
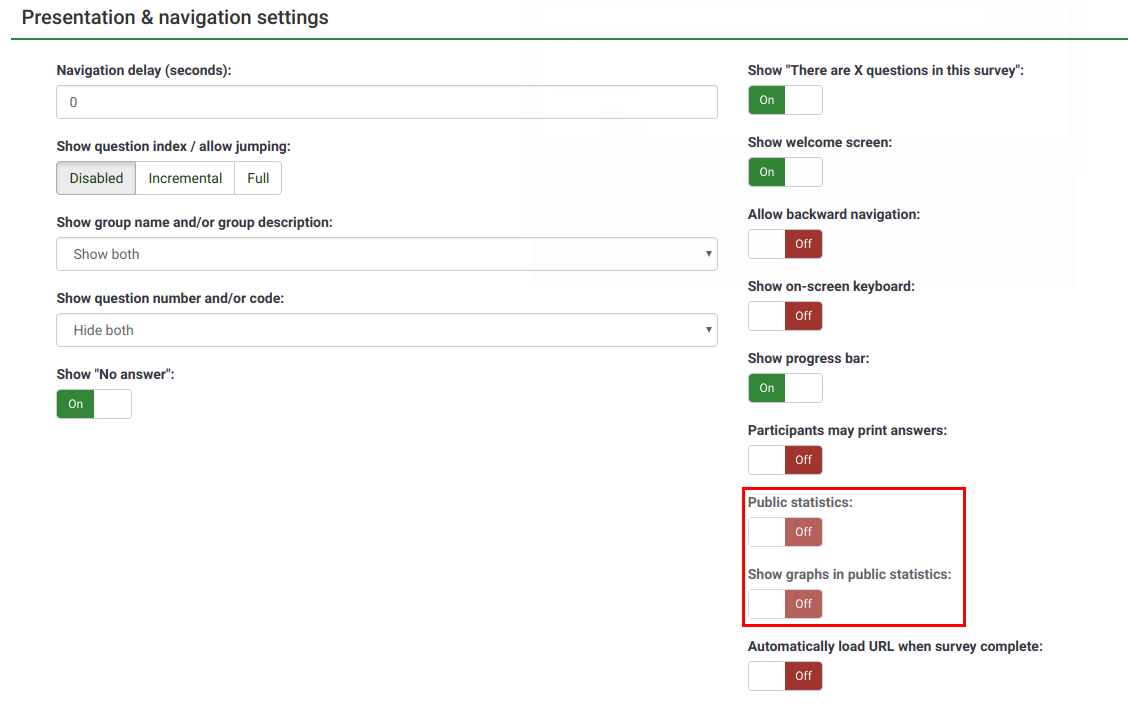
Two components need to be enabled in order to activate and display statistics to your participants. The first one refers to the public statistics of your survey which must be enabled (it is turned off by default). It is located under the Presentation tab. To also show graphs, look on the same page for the Show graphs in public statistics attribute and enable it (it is disabled by default).
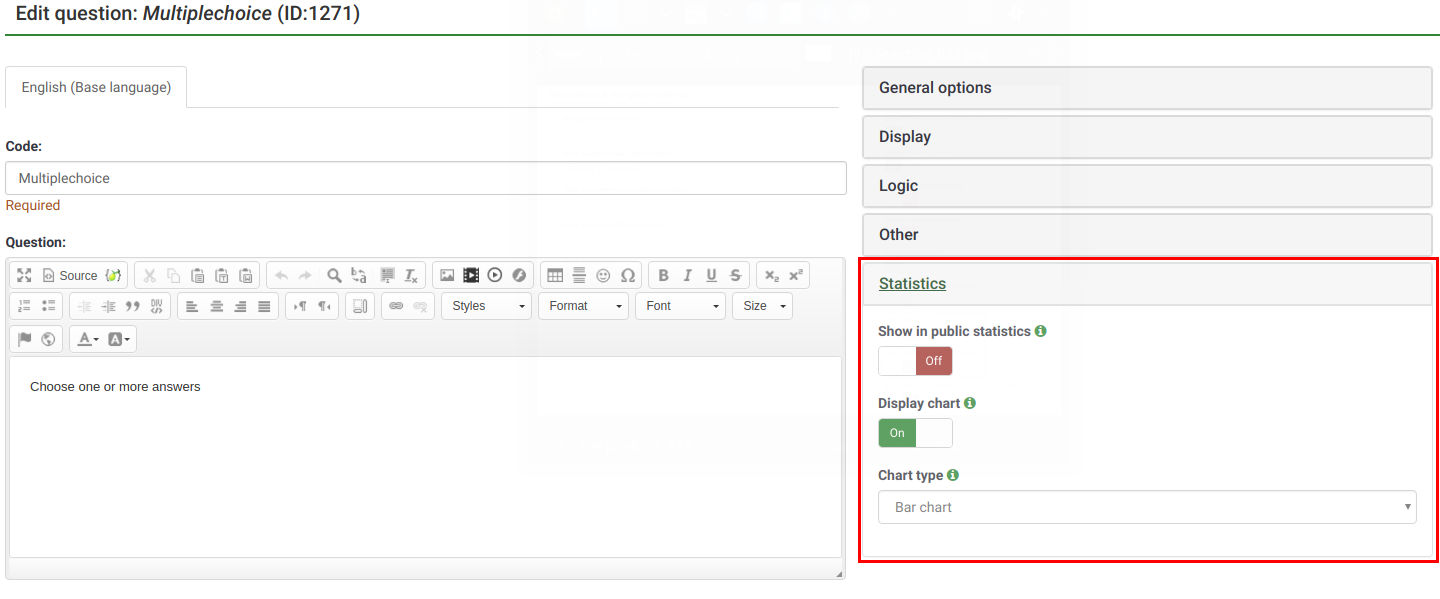
Once you have set your survey to display statistics, you need to indicate question-by-question which statistics you want to be displayed to your respondents. By default, no questions will be displayed. To have them displayed, access the desired question, look for the "Statistics" tab and enable the Show in public statistics attribute.
What participants see
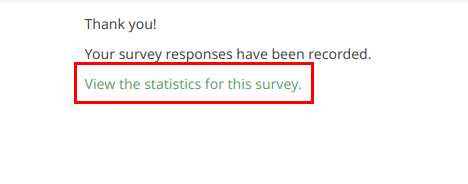
Once you have enabled public statistics and selected some questions to display, an additional option will be visible to participants when they end filling out your survey. In addition to the usual thank you, there will be a link to "View the statistics for this survey":
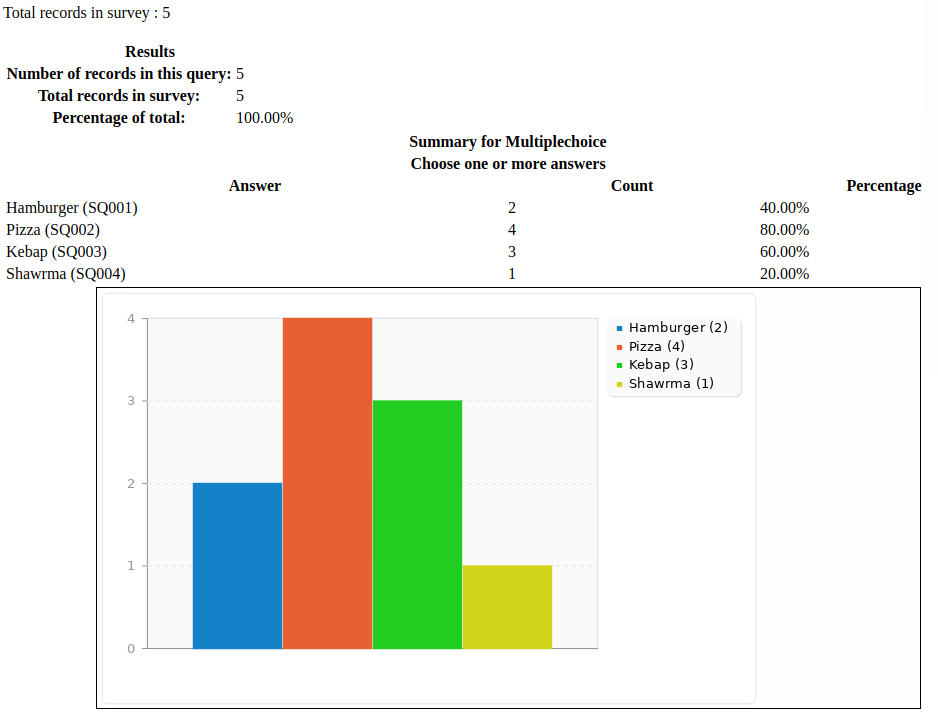
The survey statistics will be displayed on this page. Graphs can also be displayed by enabling the Display chart question attribute:
Changing the look of the public statistics page
The looks of the public statistics page can be modified via template.css (search for "#statsContainer"). However, there is currently no template of it's own that can be edited in the LimeSurvey theme editor.
Hints & tips
Feel free to edit the following wiki sections to let other LimeSurvey users learn about statistics-related hints & tips.
Wrong font when exporting statistics. What to do?
For some languages (like Chinese), the usual font used (Vera) does not cover the needed character set. In that case you can use the setting $chartfontfile to set a new TTF font file in config.php (Check out config-defaults.php for the right setting). For Chinese (Simplified and Traditional), another font has to be used such as the FireFlySung font which can be downloaded from github.
FAQs
5 point choice question type - what do the values located under the "Sum" column represent?
As it can be observed in the below screenshot, the "Sum" column shows the aggregated values in the following way:
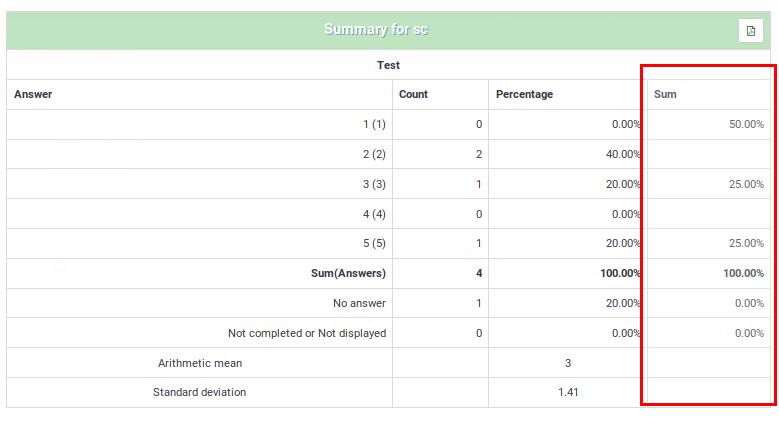
The grouping from the "Sum" column was done in this way because, when rating questions, survey administrators usually interpret the results in this way:
- Y percent of the respondents DISLIKE item ABC, where Y represents the percentage of those who answered "1" and "2"
- X percent of the respondents LIKE item ABC, where X represents the percentage of those who answered "4" and "5"
- Z percent of the respondents have a NEUTRAL opinion about item ABC, where Z represents the percentage of those who answered "3"
| Answer | Count | Sum |
|---|---|---|
| 1 | 0 | 50% (the percentage of those who answered "1" and "2") |
| 2 | 2 | |
| 3 | 1 | 25% (the percentage of those who selected "3" - the neutral option) |
| 4 | 0 | |
| 5 | 1 | 25% (the sum of those who answered "4" and "5") |
| Sum (Answers) | 4 | 100% |
| No answer | 1 | 0% (always "0%") |
| Not completed or displayed | 0 | 0% (always "0%") |