Statistics/nl: Difference between revisions
From LimeSurvey Manual
(Created page with "==Oplossen van verkeerd lettertype bij het exporteren==") |
No edit summary |
||
| Line 68: | Line 68: | ||
=Gegevens filteren= | ==Gegevens filteren== | ||
Revision as of 16:34, 20 March 2019
Algemeen
De functie statistieken is beschikbaar via de taakbalk onder Responsen bij "Responsen en statistieken" na het selecteren van een actieve enquête.

Look for the Statistics button located on the top toolbar and click on it:

The following page will be loaded:

The LimeSurvey statistics can be visualized in either the expert mode or simple mode. By default, the expert mode is loaded when you click on the Statistics button.
Expert mode
Als de enquête actief is, of al is afgelopen, dan wil je natuurlijk de resultaten gaan beoordelen. Je kunt de resultaten laten exporteren naar Excel, Word, of csv. Dan kun je er daarna natuurlijk van alles meedoen. Je kunt ook met de functie Statistieken je gegevens bekijken om daar informatie uit af te kunnen leiden.
Je kunt de gegevens filteren en aantallen en samenvattingen van diverse velden laten genereren. Het filteren is niet echt complex, maar toch kan het gemakkelijk zinvolle en verrassende informatie opleveren.
Snelle statistieken
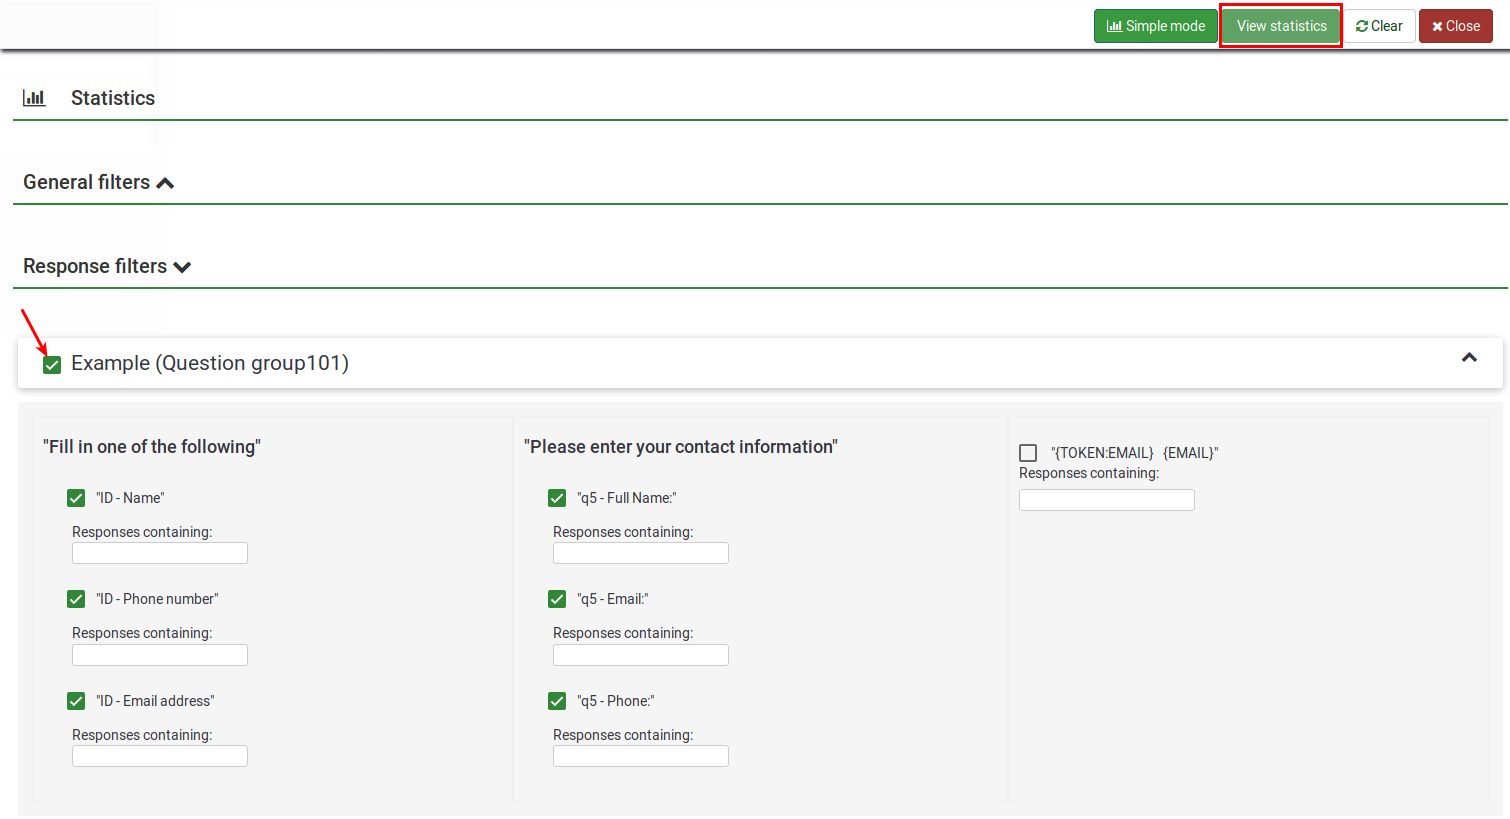
Wanneer je op de knop "Toon statistieken" klikt, dan krijg je een overzicht met alle vragen in de enquête. Elke vraag heeft een checkbox waarmee je kunt aangeven dat je een samenvatting van deze vraag wilt hebben. Als je beweegt over de (mogelijk ingekorte) vraag krijg je de hele vraag te zien. Om de resultaten voor een of meerdere vragen te zien, vink dan de checkbox(en) bovenaan de vraag/vragen aan en klik op "Toon statistieken". Je kunt ook alle resultaten laten tonen, dan vink je de keuze bovenin "Toon samenvatting van alle beschikbare velden" aan.
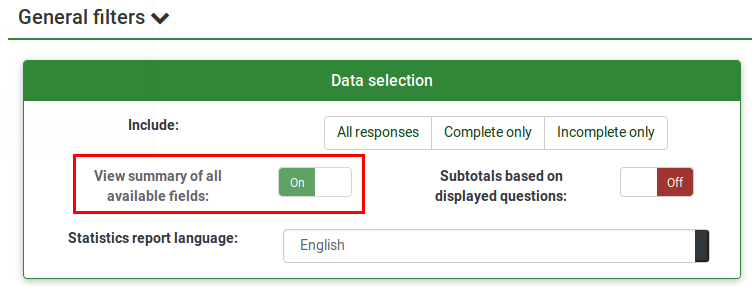
Alternatively, to view the results for all available questions, enable "View summary of all available fields" and then click "View statistics":
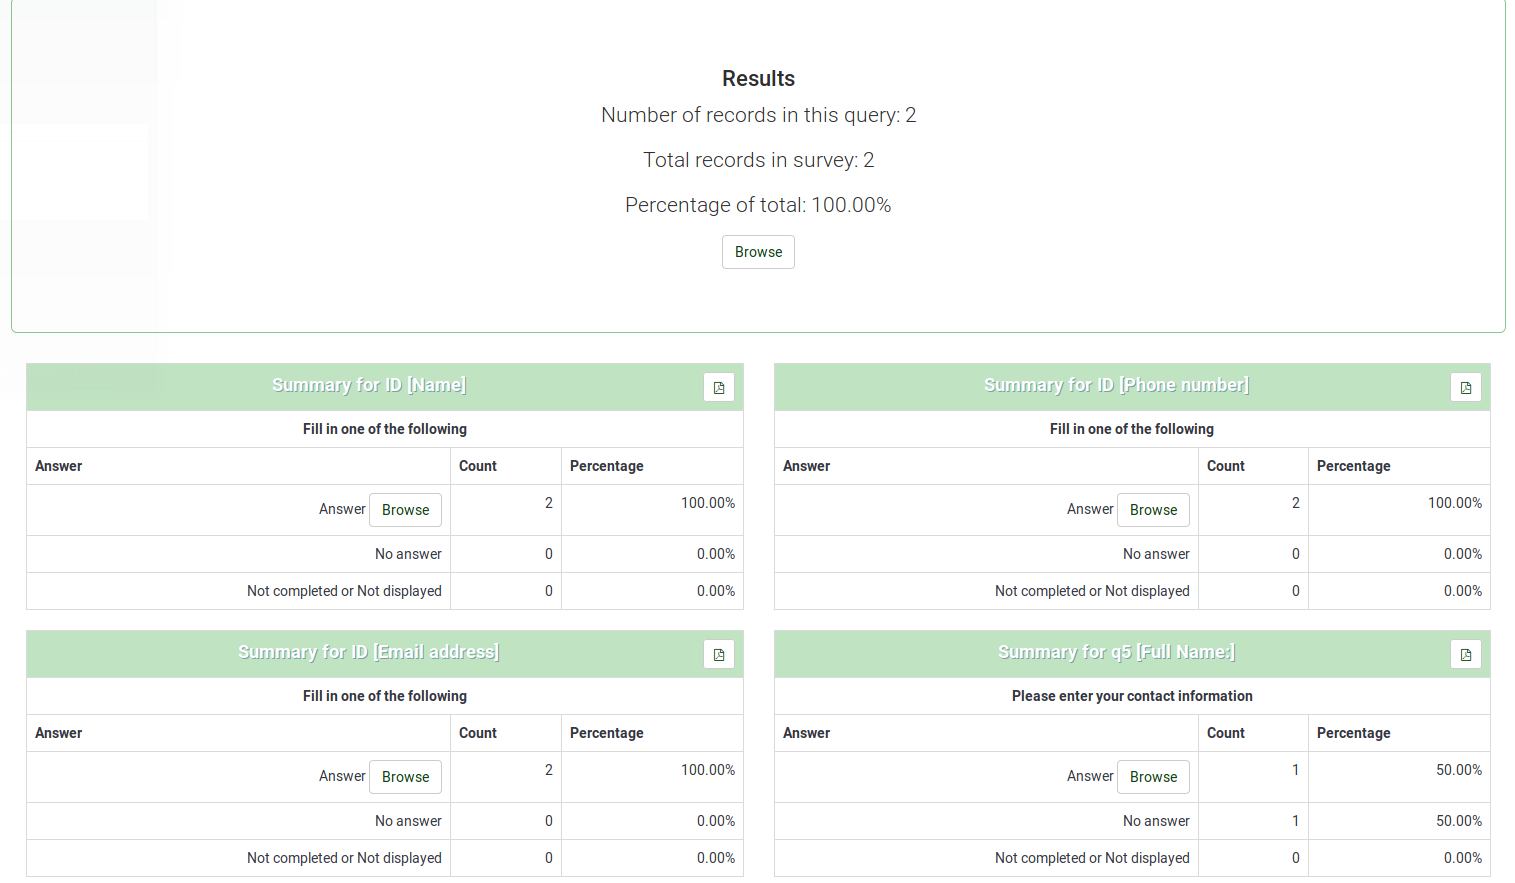
Je krijgt een overzicht met de resultaten, waarin het aantal en een samenvatting voor elke gekozen vraag wordt aangegeven, dit met een samenvatting van alle mogelijke antwoorden in die betreffende vraag. Dit uiteraard met de totalen en ook met een percentage.
Gegevens filteren
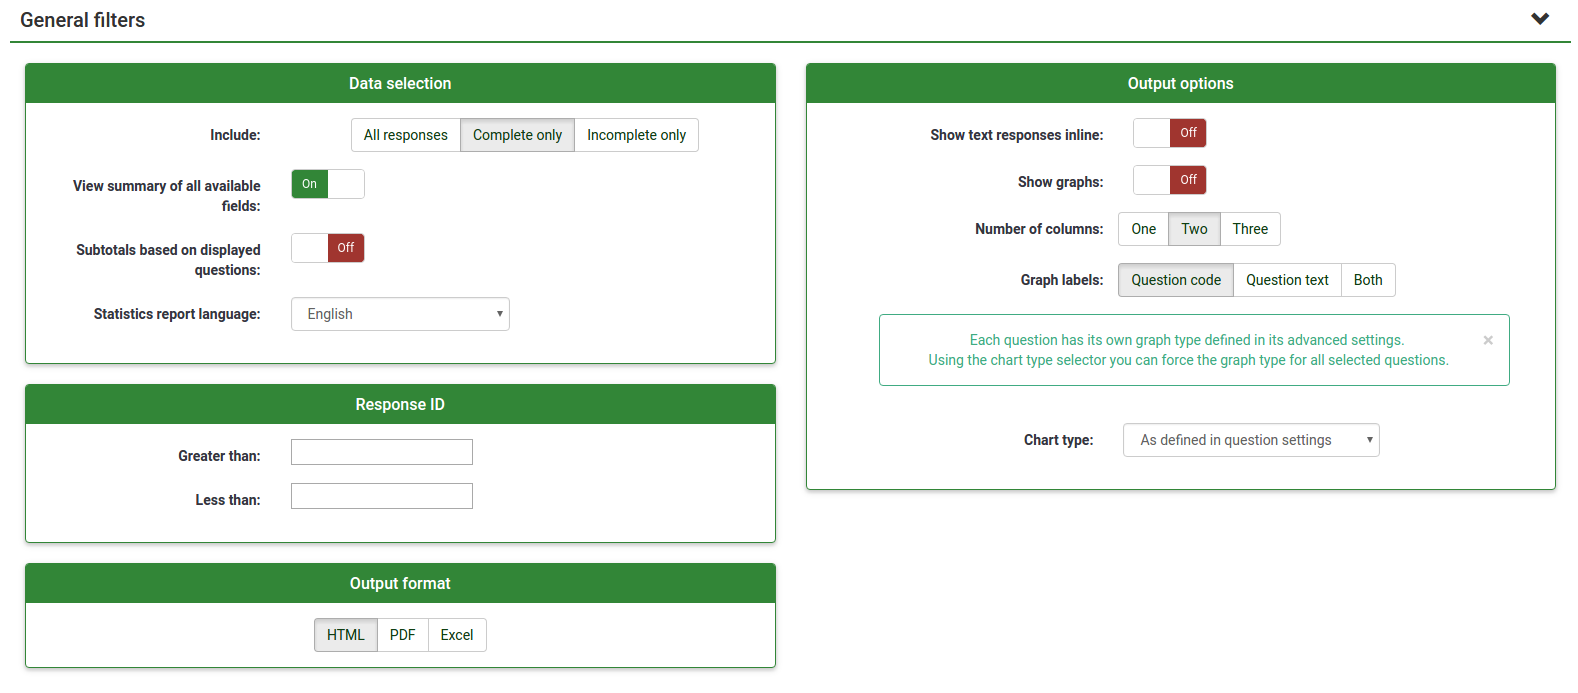
Two types of filters exist: general and response filters.
Algemene filters
Data filteren kan op meerdere manieren:
- Op volledigheid van de respons - kies achter het veld Inclusief: Alle responsen, Alleen voltooide of Alleen onvoltooide. Lees Bekijken resultaten.
- Op ID - selectie op ID van de respons
- Op respons - selecteer een of meerdere responsen in de lijst onder elke vraag om de gegevens te filteren op die responsen (Je kunt er meerdere selecteren door de CTRL-toets ingedrukt te houden bij het selecteren bij dezelfde vraag). Als je een samenvatting wilt van alle velden (checkbox bovenin), stel dan eerst je filters in voordat je deze keuze maakt.
- Op tekst - Je kunt in vraagtypes met vrije tekst selecteren op tekst. Je kunt hierbij ook een %-teken gebruiken. Voorbeeld: als je zoekt op 'Tom%' dan krijgt je alle teksten in dat veld met de teksten als 'Tombe' en 'Tommy', enz.
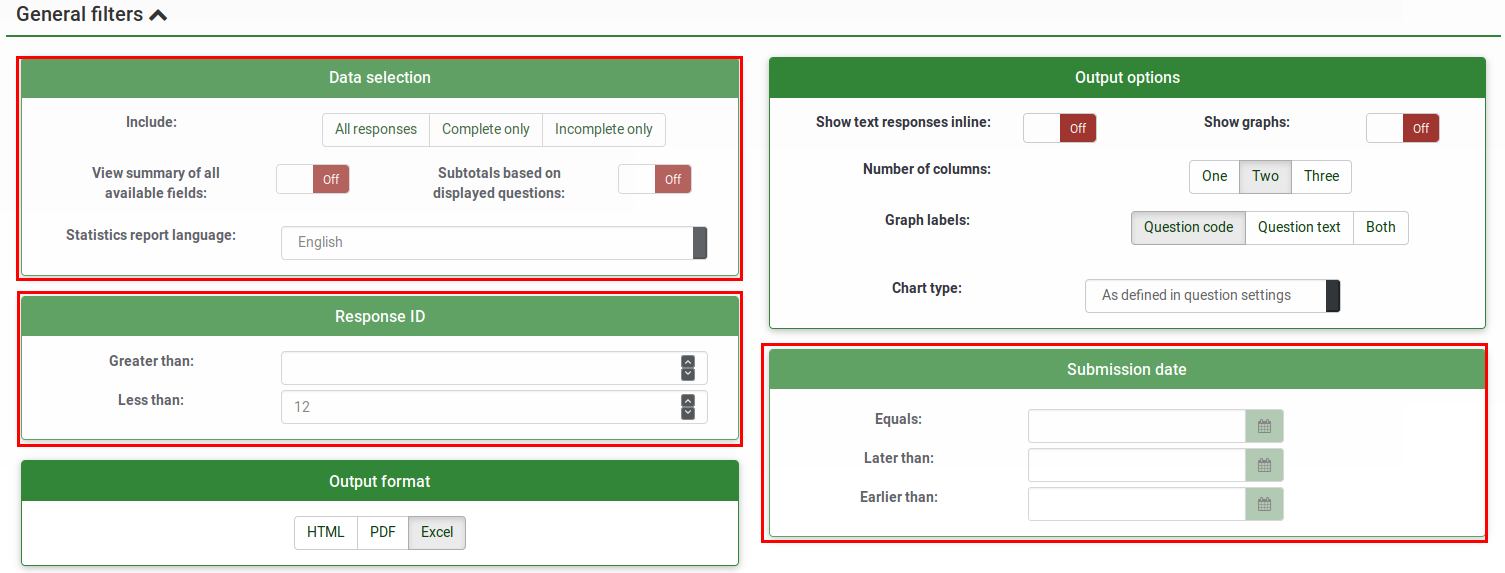
De filters kunnen betrekking hebben op:
- Data selection
- The type of responses:
- Complete responses: responses that contain a submission date
- Incomplete responses: answers that do not contain a submission date
- All records: the aggregated number of complete and incomplete responses.
- Statistics report language: if additional languages are used, this filter option is useful to divide respondents based on the language they used to fill out your survey.
- The type of responses:
- View summary of all available field: it is turned off by default. By enabling it, all the survey questions and groups will be taken into account when running the statistics script
- Subtotals based on displayed questions: it is deactivated by default. It counts stats for each question based only on the total number of responses for which the question was displayed (good way to filter the unfinished/incomplete responses).
- Response ID: use the ID number to filter your gathered responses
- Submission date: displayed only if timings is enabled. You can filter the data based on the submission date of your collected responses.
To get the answers filtered according only to the general filters, enable the "View summary of all available field" option and click on the View statistics button located in the upper-right part of the screen.
Respons filters
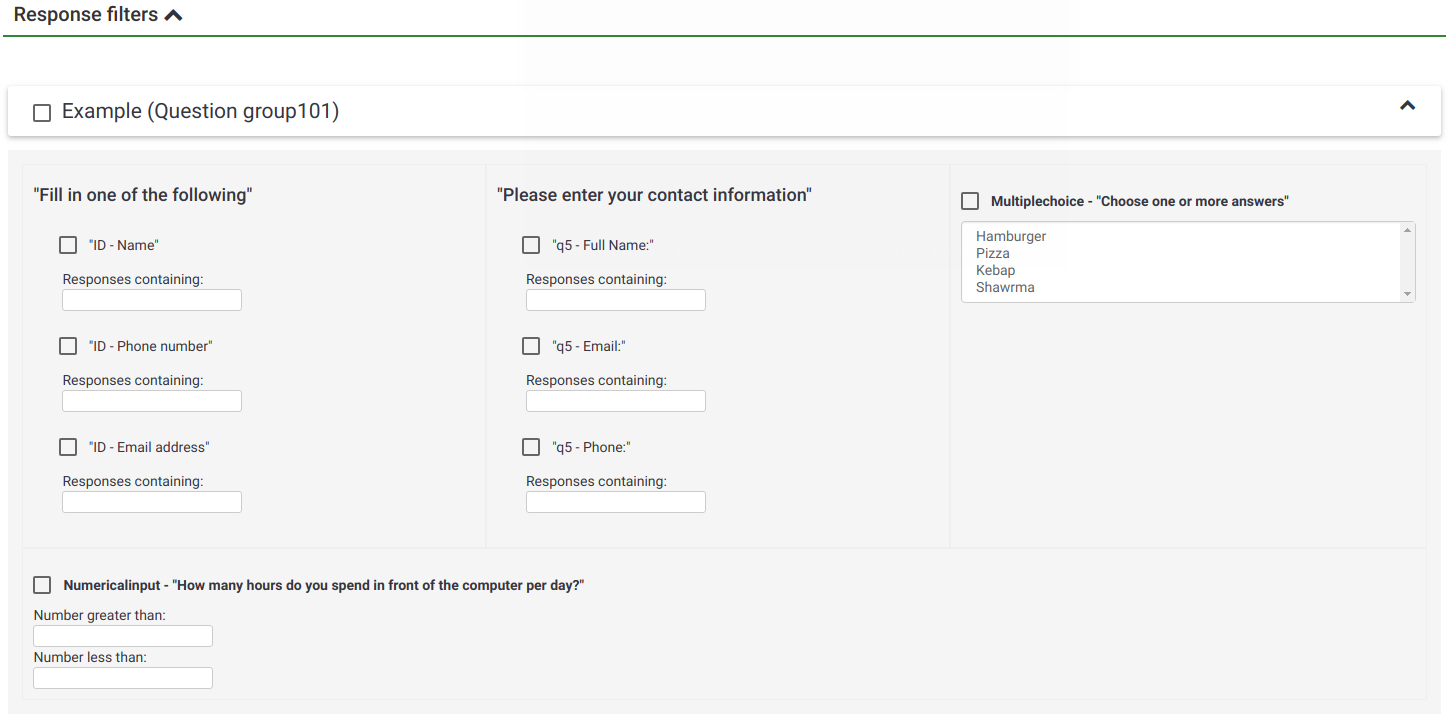
Depending on the used question type, different fields may be used to filter your answers:
- By response: click on one or more responses in the list under each question to filter the data by those responses (use CTRL/click to select multiple responses in the same question). Note that if you choose to view the summary of all available fields (checkbox at top) you will need to select your response filters before checking that box.
- By text: you can search the responses to a free text question type (and similar types) by entering a text. If you want to search for a partial string you can use the percentage sign (%) as wildcard. E.g.: If you look for 'Tom%', it will find entries with 'Tomb' and 'Tommy', etc.
- By numerical value: you can search the responses that contain a certain numerical value if number-based question types are used.
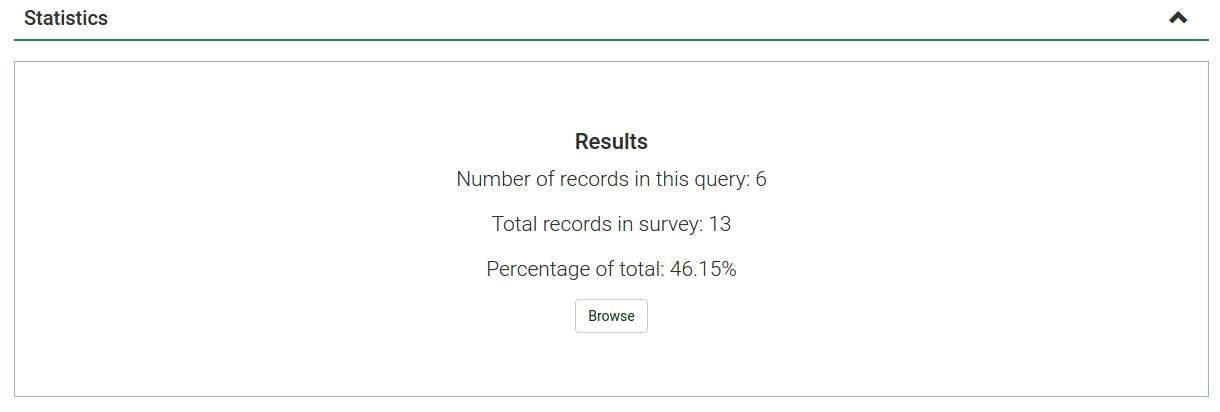
Na de keuze "Toon statistieken" krijg je een overzicht met het aantal resultaten dat aan je criteria voldoet, en per gekozen vraag een lijst met alle mogelijke antwoorden, hun totalen en de percentages. Deze resultaten zijn natuurlijk maar een gedeelte van de ingestuurde responsen, want je hebt criteria kunnen opgeven. Als je er 146 selecteert van de in totaal 180 responsen, dan is de samenvatting ook maar op grond van die 146.
De onderstaande afbeeldingen tonen de statistieken voor de "Werknemersstatus" van alleen volledige responsen/vrouw/leeftijd 18-25. Dat zijn er in dit geval 6 van de 13.
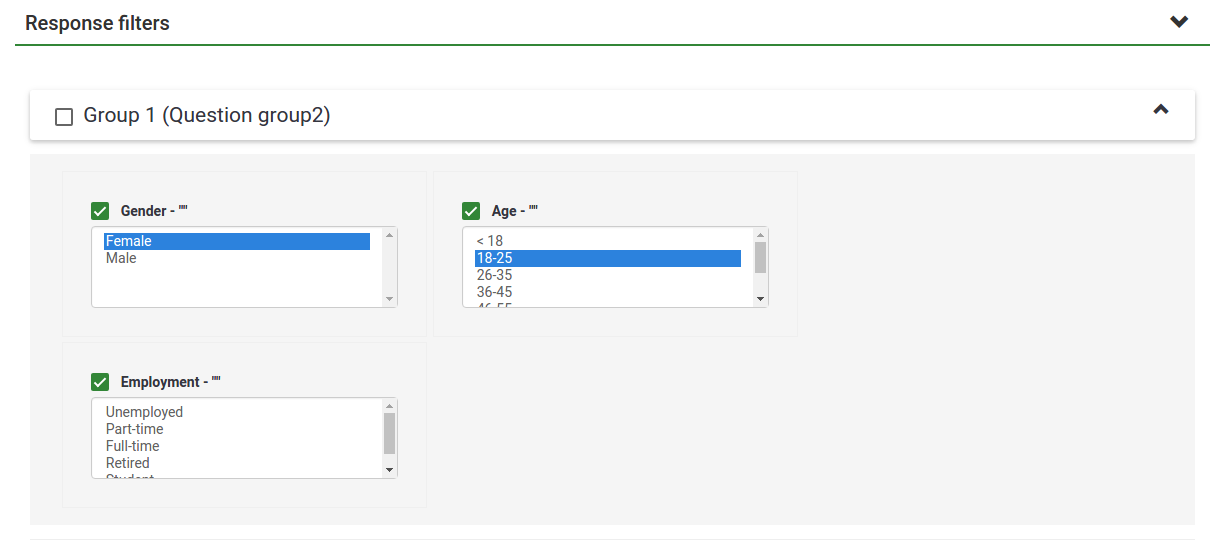
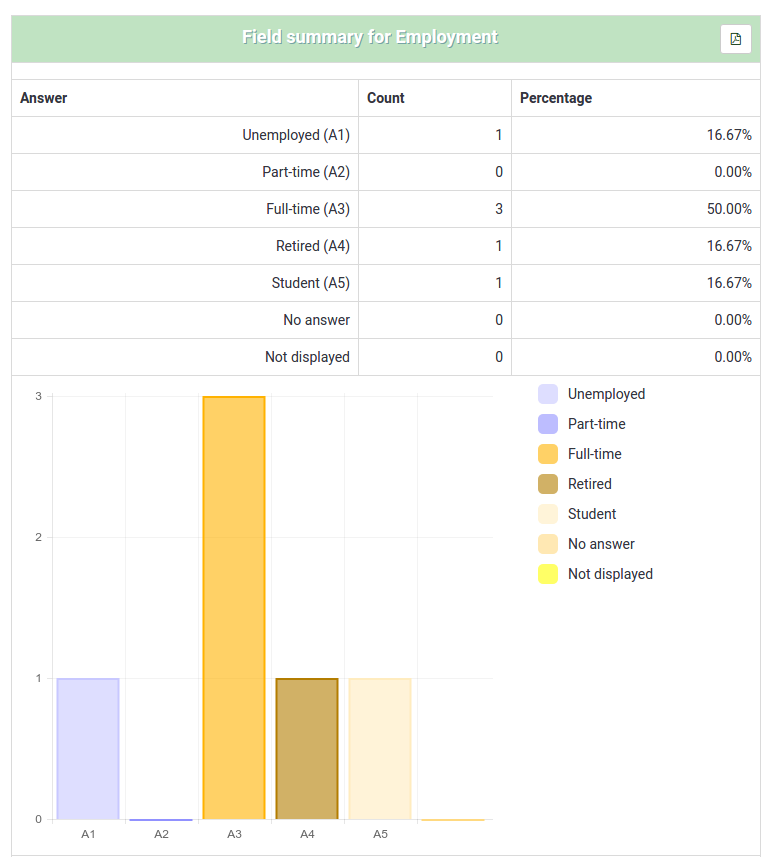
- Als je een criteria gebruikt op een vraag die je ook wilt tonen in de samenvatting, dan krijg je alleen de antwoorden die aan de criteria voldoen.
- Je kunt meerdere opties kiezen door de CTRL-toets ingedrukt te houden als je een optie selecteert. Een gekozen optie kun je weer niet meenemen door er op te klikken, met de CTRL-toets ingedrukt als je de andere gekozen opties wilt laten staan.
Diagrammen
Bij het maken van diagrammen wordt de bibliotheek pChart gebruikt, deze is standaard beschikbaar en hoeft normaal gesproken niet te worden ingesteld.
Na het genereren van de diagrammen kun je deze eenvoudig exporteren. Klik met de rechter muistoets op het plaatje en kies "Afbeelding opslaan als...". Sla het op als png-bestand. Standaard worden diagrammen in taartvorm getoond, alleen voor meerkeuzevragen worden staafdiagrammen gebruikt.
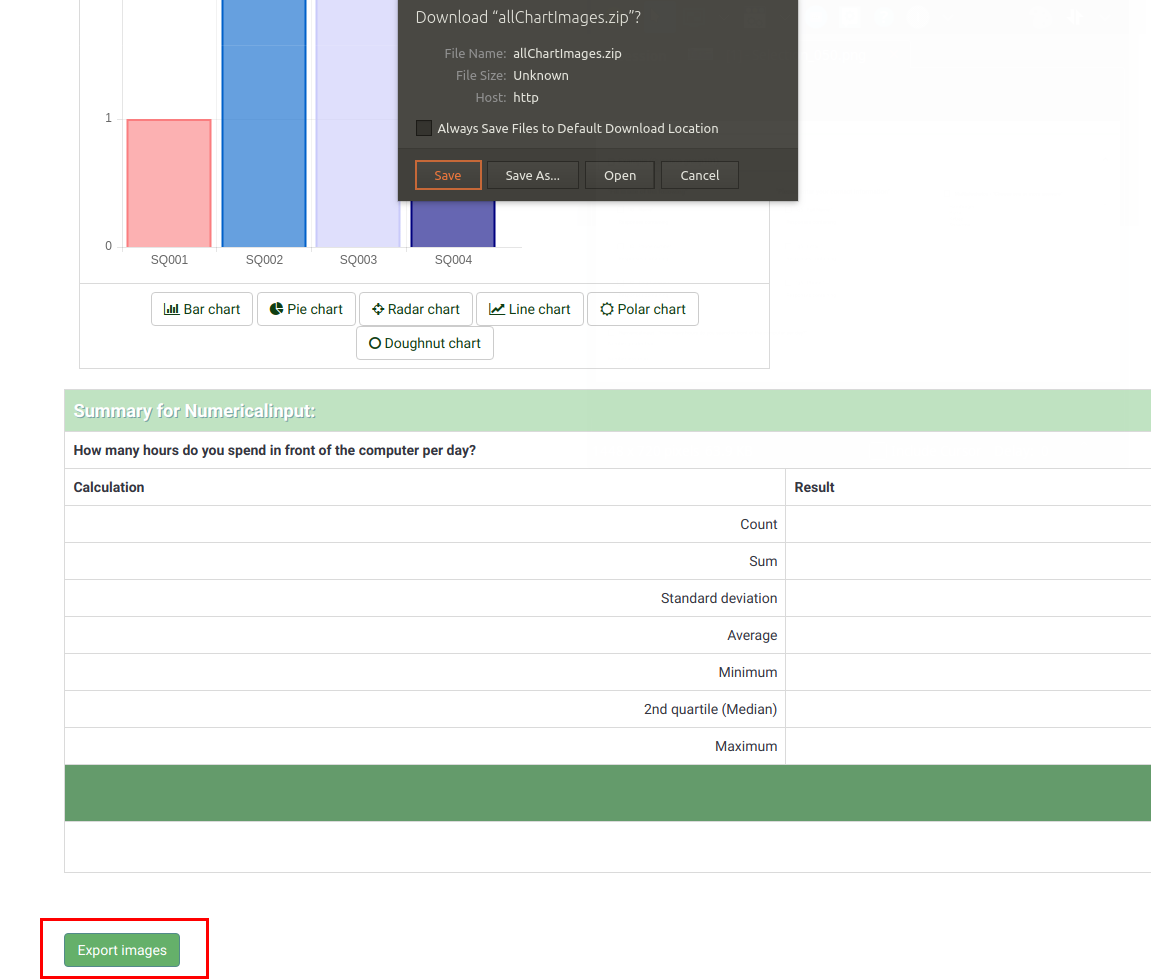
You can also use the "Export images" function to save all the graphs to your machine:
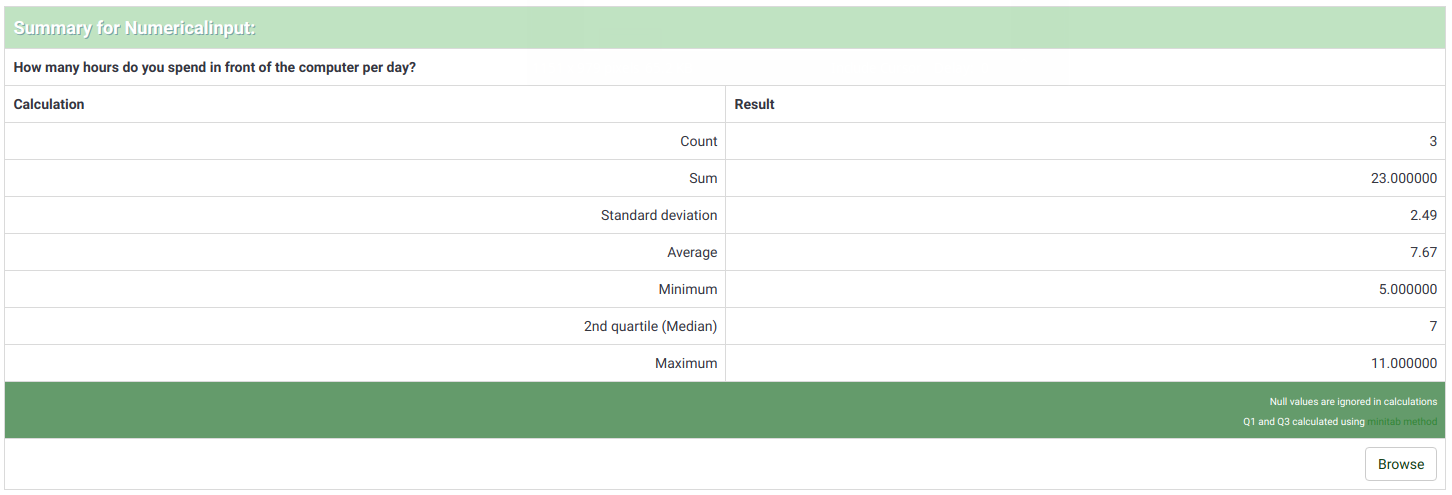
"Onvolledige responsen", "Geen antwoord" en "Niet afgerond / Niet getoond" tellen
- "Onvolledige respons" : een respons waar de gebruiker met invullen mee is begonnen, maar die niet heeft voltooid door op verzenden te klikken.
Er is dan in dit record dus geen SubmitDate in de responstabel.
- "Geen antwoord": een vraag die is getoond, maar waar de gebruiker geen antwoord op heeft gegeven.
De gebruiker kan een niet verplichte vraag overslaan. Er is dan een waarde "" (lege string) opgeslagen in de database bij deze vraag. Dit kan natuurlijk niet voor datums of numerieke invoer.
- "Niet afgerond/Niet getoond" : als de pagina met de vraag niet is getoond. Het kan door condities komen dat een pagina / vraag niet wordt getoond. De deelnemer kan ook de enquête onvolledig hebben ingevuld, zonder deze vraag te beantwoorden.
Een techneut zou zeggen, er staat in dit veld in de database een NULL.
Output format and options
The statistics can be displayed under three different formats:
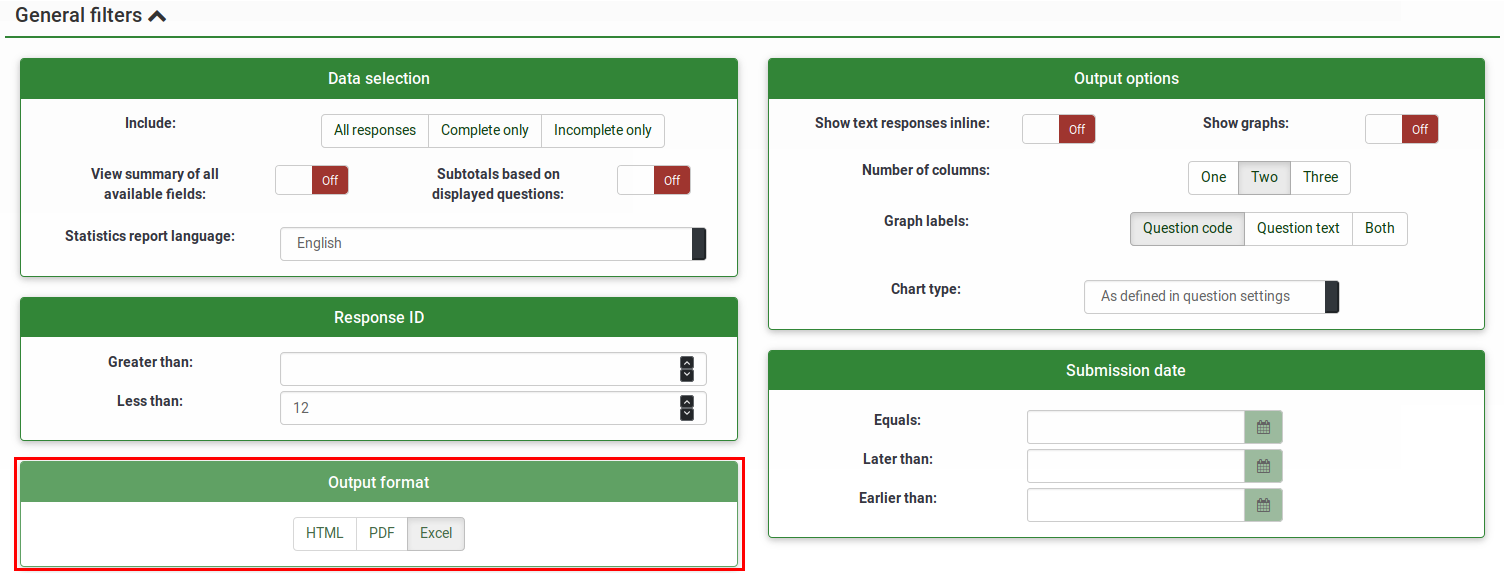
- HTML (default option): the statistics are displayed in LimeSurvey
- PDF: a popup will be displayed, asking to save the statistics as a PDF file
- Excel: To further work with your (filtered) data, choose Excel. You can export the file from a spreadsheet application to CSV to work with more advanced statistical tools such as SPSS or R.
The output options can be used to alter the way in which the statistics are displayed. The following options are available:
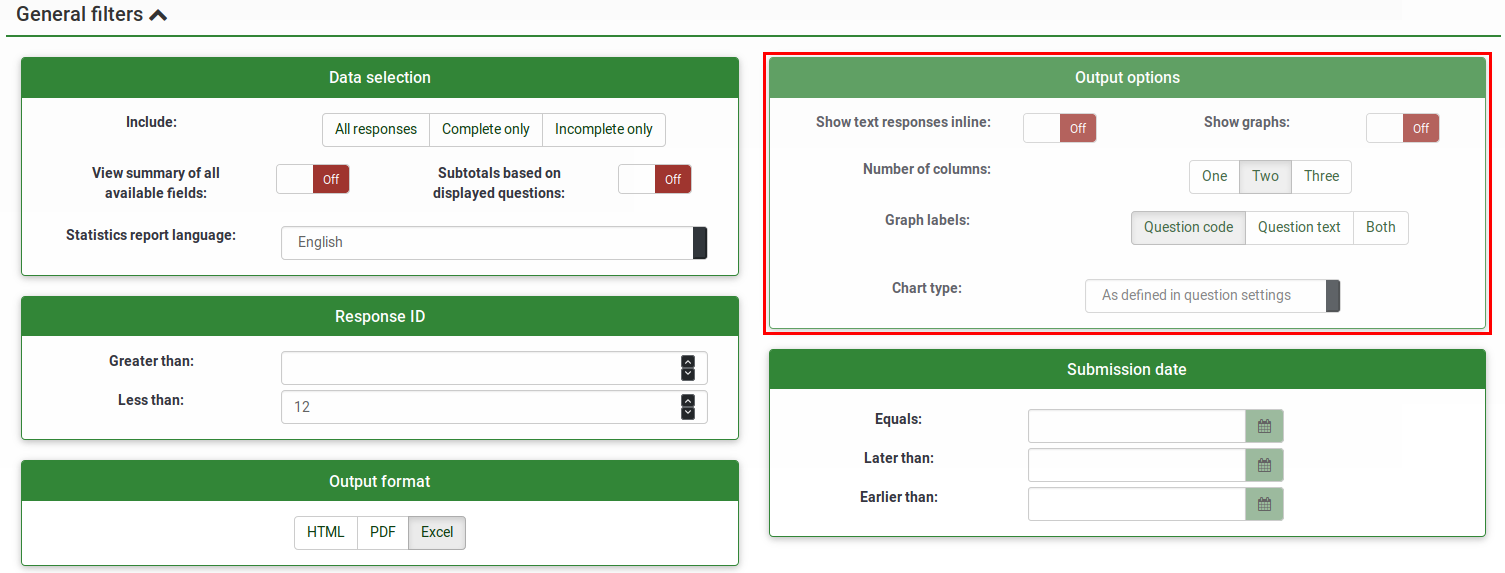
- Show text responses inline: it is disabled by default. It shows the text questions responses without having to click on a browse button (if enabled; useful for the HTML version of output format)
- Show graphs: it is disabled by default. If enabled, graphs will be displayed
- Number of columns: two is the default number. If you wish to have statistics and graphs displayed on only one or three columns, choose the desired value from this option. It applies to HTML statistics.
- Graph labels: choose how the label should look like in the graph.
- Question code
- Question text
- Both
- Chart type: the following chart type settings are available:
- As defined in question settings: useful if you wish the graph not to be displayed. If this is the case, deactivate it from the question settings and select from the "Statistics" panel this option.
- Bar chart
- Pie chart
- Radar chart
- Line chart
- Polar chart
- Doughnut chart
Statistics - simple mode
The simple mode was created in order to provide simple bar chart statistics that can be quickly exported and saved, and then included into a presentation:
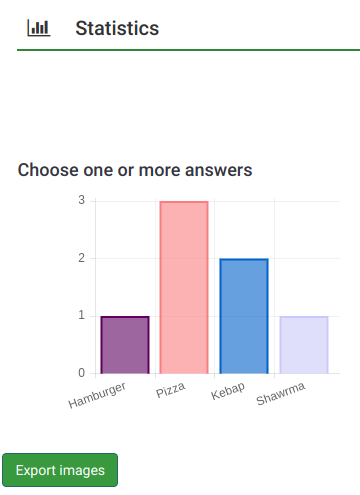
As you can observe, fewer graphs are displayed than in the expert mode. While in the export mode you can display graphs with respect to those who filled out the survey, did not answer it or did not finish completing it, the simple mode displays only statistics that rely on the "countable" data submitted by the respondents (e.g., single or multiple choice questions as well as array questions).
There is only one option to filter the data within the simple mode - via the responses to be included in the statistics. As a result, the statistics may include the complete responses, incomplete responses, or all responses (the aggregated sum of the first two options). This option is located in the upper-right part of the panel.
To switch back to expert mode, look for the "Expert mode" button located in the upper-right part of the screen:

Openbare statistieken
LimeSurvey heeft de functionaliteit om eenvoudige statistieken aan iedereen of de deelnemer te tonen, na het on-line invullen van de enquête.
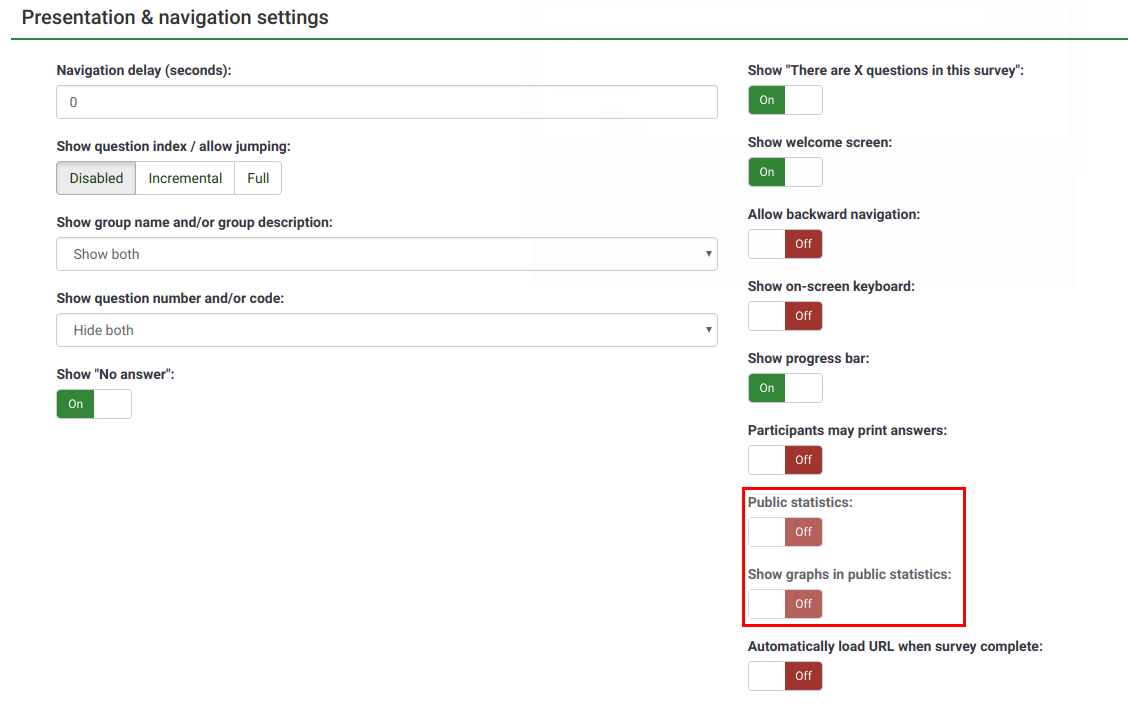
Als je dit wilt, dan zijn er twee stappen nodig. Je moet bij de enquête de instelling Openbare statistieken inschakelen (zie Instellingen – Presentatie). Ook de instelling "Toon diagrammen in openbare statistieken" moet aan gezet worden (ook de totalen worden dan getoond), Standaard worden alleen numerieke statistieken getoond.
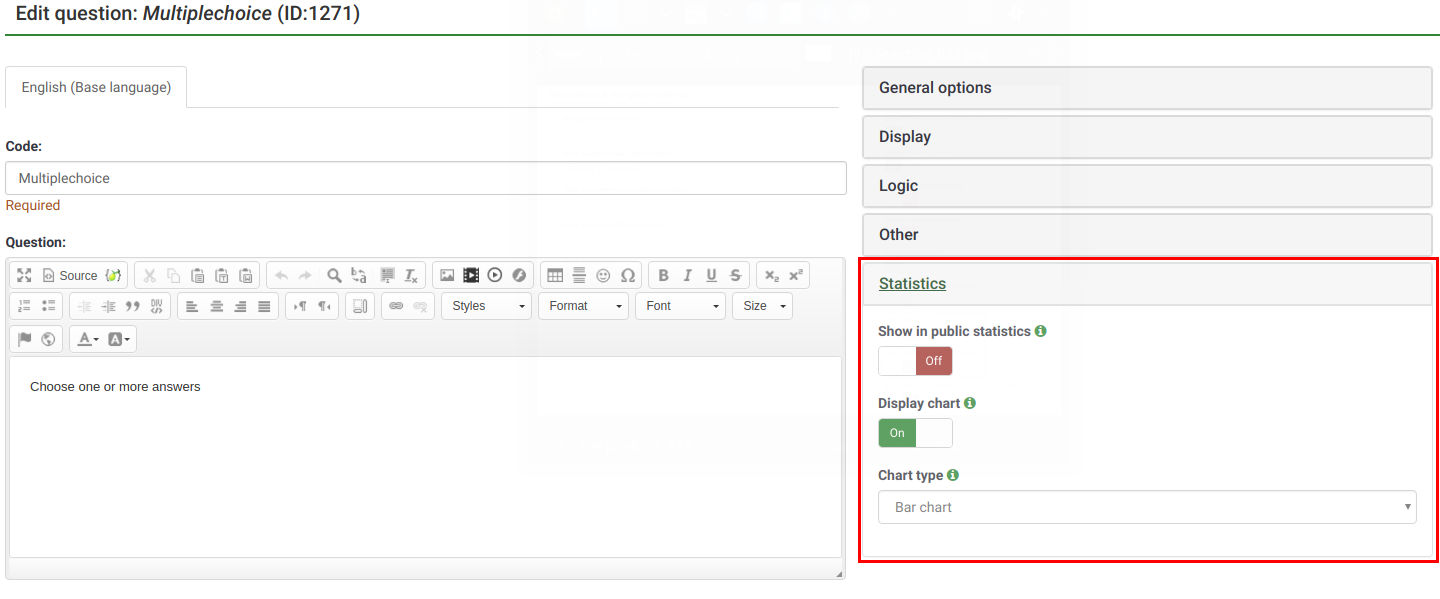
Bij een vraag waarvan je statistieken wilt tonen aan de deelnemer, kies je bij het wijzigen van die vraag voor de tab "Statistieken. De instelling is "Toon in openbare statistieken".
Wat de deelnemer ziet
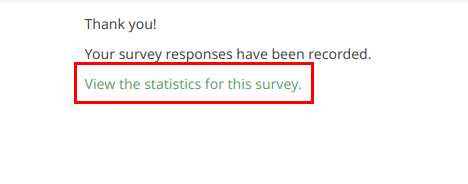
Na het inschakelen van de openbare statistieken en het selecteren van een of meer vragen voor openbare statistieken door de beheerder van de enquête, ziet de deelnemer nadat de enquête afgerond is, een extra optie op de bedankpagina. Er is een link "Toon statistieken van deze enquête."
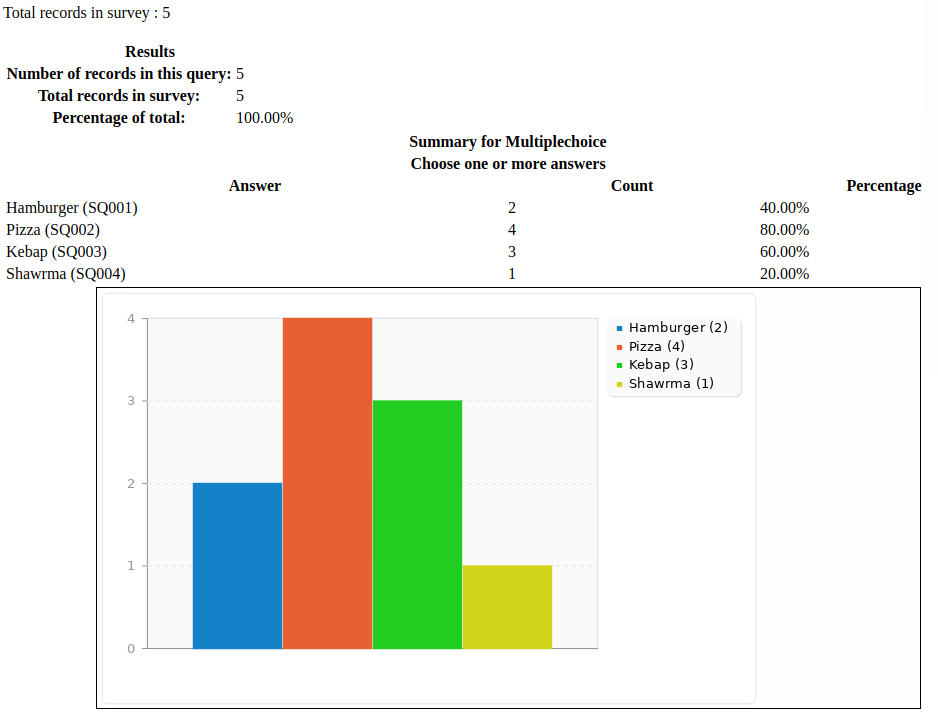
Als de deelnemer hier op klikt, dan krijgen ze een pagina met de statistieken die door de beheerder van de enquête is samengesteld (dus optioneel met diagrammen).
Uiterlijk openbare statistieken wijzigen
Je kunt het uiterlijk van de openbare statistieken wijzigen door de template.css te wijzigen (zoek naar "#statsContainer"). Er is nu geen eigen sjabloon dat je met de sjablooneditor kunt wijzigen.
Tips
Feel free to edit the following wiki sections to let other LimeSurvey users learn about statistics-related hints & tips.
Oplossen van verkeerd lettertype bij het exporteren
Voor sommige talen (o.a. Chinees) kent het standaard gebruikte font (Vera) niet de hele benodigde tekenset. In dat geval kun je in config.php via de instelling $chartfontfile een ander TTF font gebruiken (Zie config-defaults.php). Voor Chinees (vereenvoudigd en traditioneel) bevelen we het font FireFlySung aan, dat kun je downloaden op [1].
Veel gestelde vragen
5 point choice question type - what do the values located under the "Sum" column represent?
As it can be observed in the below screenshot, the "Sum" column shows the aggregated values in the following way:
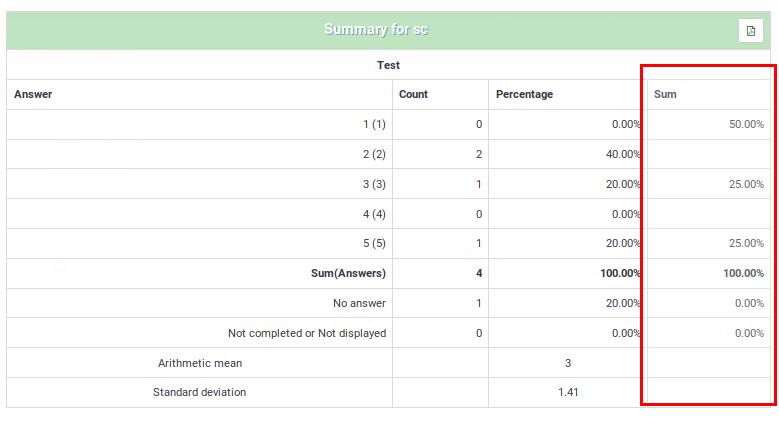
The grouping from the "Sum" column was done in this way because, when rating questions, survey administrators usually interpret the results in this way:
- Y percent of the respondents DISLIKE item ABC, where Y represents the percentage of those who answered "1" and "2"
- X percent of the respondents LIKE item ABC, where X represents the percentage of those who answered "4" and "5"
- Z percent of the respondents have a NEUTRAL opinion about item ABC, where Z represents the percentage of those who answered "3"
| Answer | Count | Sum |
|---|---|---|
| 1 | 0 | 50% (the percentage of those who answered "1" and "2") |
| 2 | 2 | |
| 3 | 1 | 25% (the percentage of those who selected "3" - the neutral option) |
| 4 | 0 | |
| 5 | 1 | 25% (the sum of those who answered "4" and "5") |
| Sum (Answers) | 4 | 100% |
| No answer | 1 | 0% (always "0%") |
| Not completed or displayed | 0 | 0% (always "0%") |