Statistici
From LimeSurvey Manual
General
Scopul unui sondaj este de a „obține răspunsuri la întrebări”. După ce ați creat, activat și invitat participanții să completeze sondajul dvs., puteți utiliza funcționalitatea „Răspunsuri și statistici” pentru a colecta și analiza rezultatele sondajului pentru a obține răspunsuri.
Caracteristica de statistici este situată sub meniul de răspunsuri al unui sondaj activ: Răspunsuri > Răspunsuri și statistici Răspunsuri este disponibilă numai dacă un sondaj a fost activat.
Faceți clic pe „Statistici” situat în bara de instrumente de sus.

Va fi afișată următoarea pagină.
Statisticile LimeSurvey pot fi afișate fie în „modul expert” fie în „modul simplu”. În mod implicit, „modul expert' este afișat când faceți clic pe Statistici
Statistici - modul expert
Sondajul dvs. s-a încheiat și acum doriți să începeți să analizați rezultatele. LimeSurvey poate exporta toate rezultatele într-o foaie de calcul Excel sau într-un fișier CSV.
Funcția statistici - modul expert vă permite să „filtrați” datele și să preluați numere și rezumate ale diferitelor câmpuri. Scriptul de statistici nu face o filtrare foarte complexă, dar există o mulțime de informații foarte utile care pot fi obținute cu ușurință.
Rularea rapidă a statisticilor
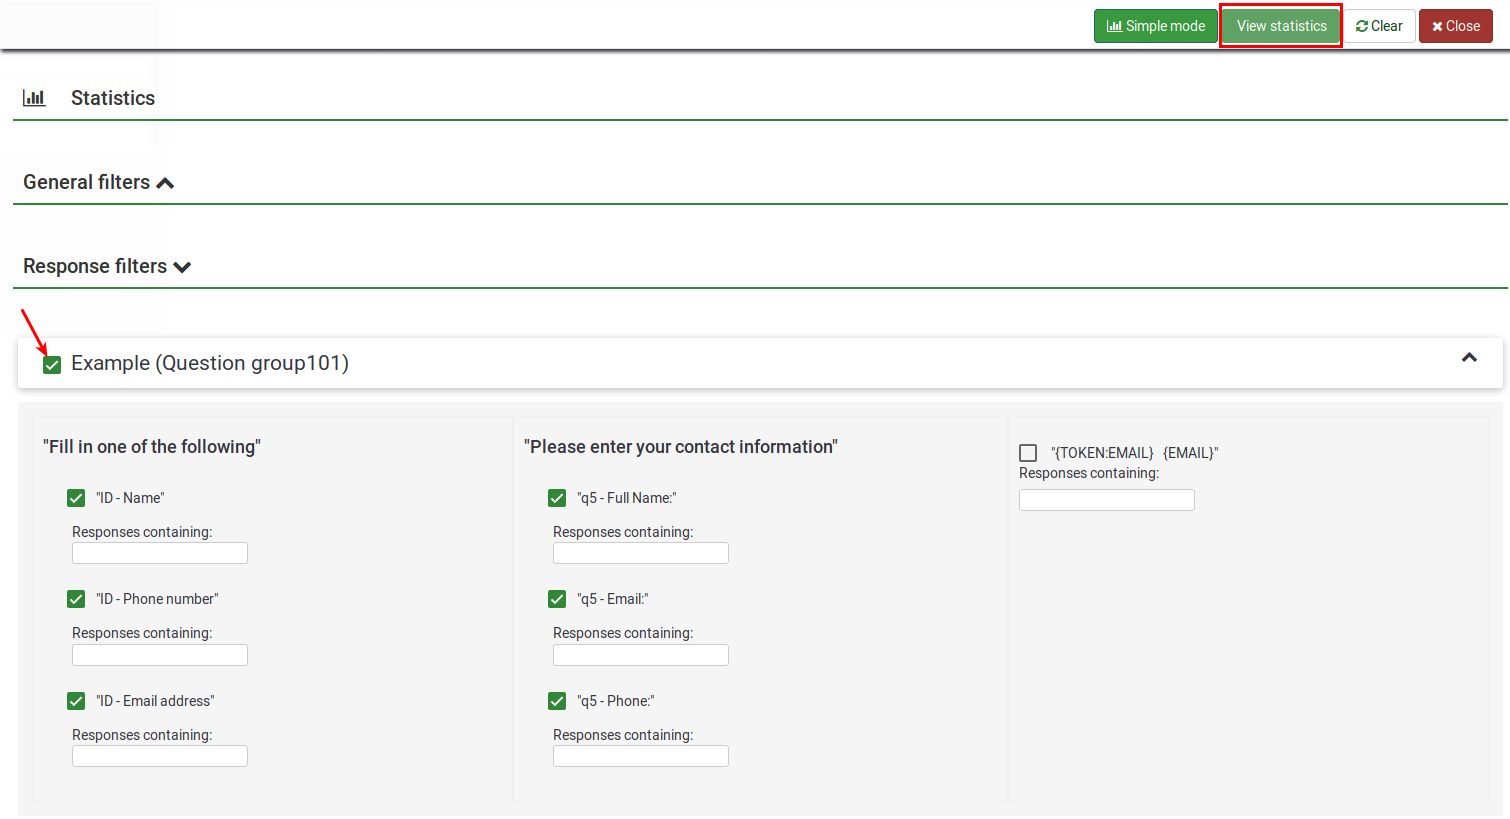
În captura de ecran de mai jos, puteți vedea că există o casetă de selectare pentru fiecare întrebare care poate fi selectată pentru a afișa un rezumat al răspunsurilor pentru fiecare întrebare și o pictogramă care, atunci când dați clic (sau dacă mouse-ul trece peste ea), vă oferă textul integral al întrebării. Pentru a vedea rezultatele pentru o întrebare sau întrebări, bifați casetele de selectare din partea de sus a întrebării și apoi faceți clic pe „Vedeți statistici”.
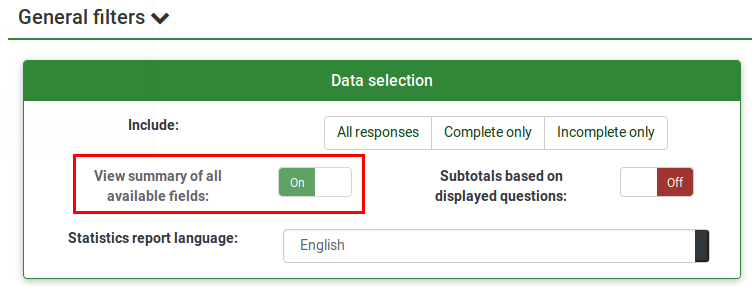
Ca alternativă, pentru a vedea rezultatele pentru toate întrebările disponibile, activați „Vizualizați rezumatul tuturor câmpurilor disponibile” și apoi faceți clic pe „Vizualizați statisticile”.
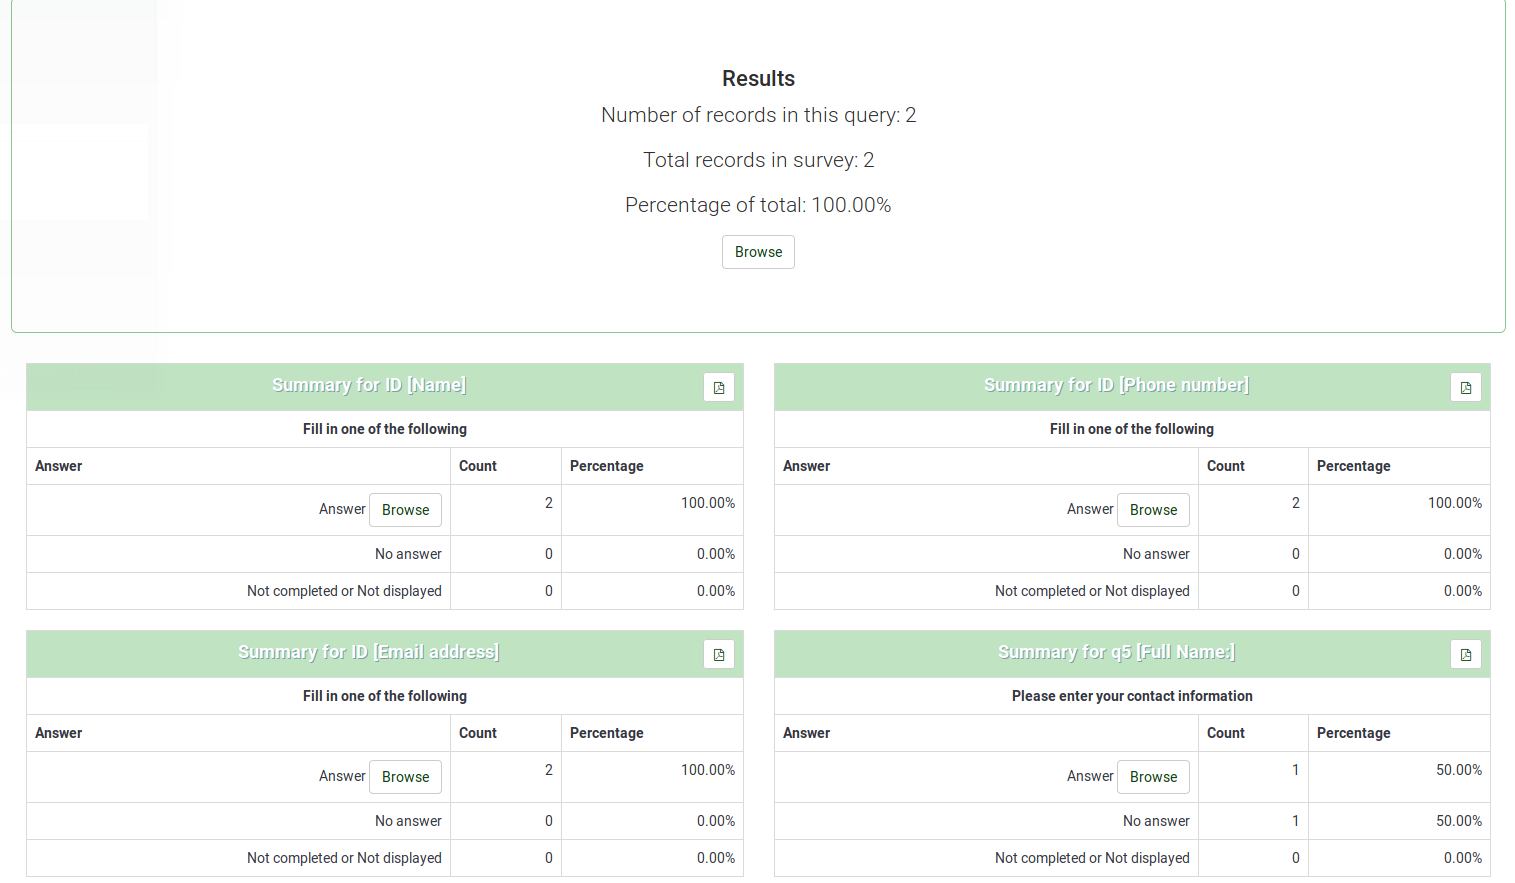
Vi se va oferi apoi un tabel „Rezultate" care va indica numărul de cazuri și un tabel „Field Summary” pentru fiecare întrebare selectată, care rezumă toate răspunsurile posibile la întrebare(e), totalurile acestora și corespunzătoare. procent.
Filtrarea datelor
Există două tipuri de filtre: general și filtre de răspuns.
Filtre generale
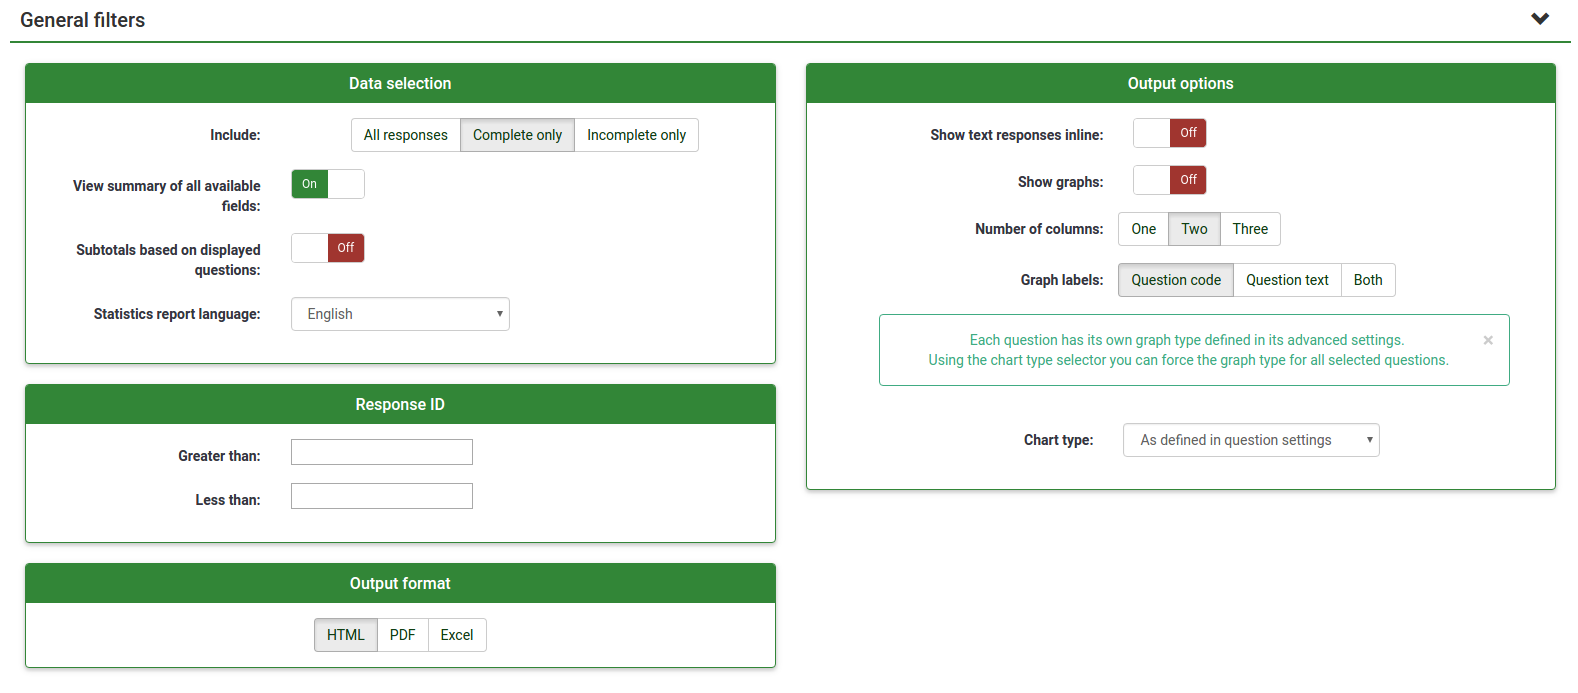
După cum sugerează și numele, „Filtrele generale” se referă la filtre la nivel general (macro).
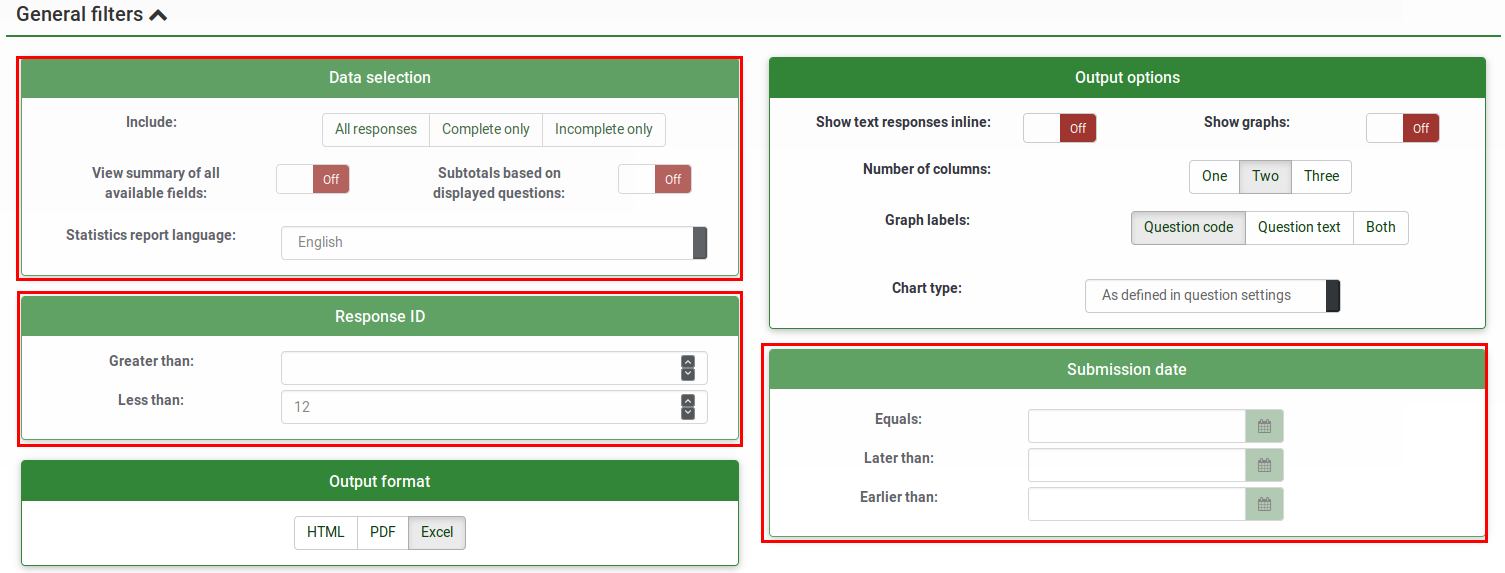
Filtrele pot fi legate de:
- Selectarea datelor
- Tipul de răspunsuri:
- Răspunsuri complete: răspunsuri care conțin o dată de trimitere
- Răspunsuri incomplete: răspunsuri care nu nu conțin o dată de trimitere
- Toate înregistrările: numărul agregat de răspunsuri complete și incomplete.
- „Limba raportului statistic:” dacă sunt folosite limbi suplimentare, această opțiune de filtru este utilă pentru împărțirea participanților pe baza limbajului pe care l-au folosit pentru a completa, completați sondajul..
- Tipul de răspunsuri:
- Vedeți rezumatul tuturor câmpurilor disponibile: Dezactivat implicit. Prin activarea acesteia, toate întrebările și grupurile de sondaj vor fi luate în considerare la rularea scriptului de statistici
- Subtotaluri bazate pe întrebările afișate: Dezactivat implicit. Numărează statistici pentru fiecare întrebare pe baza numărului total de răspunsuri pentru care a fost afișată întrebarea (o modalitate bună de a filtra răspunsurile nefinalizate/incomplete).
- ID răspuns: Folosiți numărul ID pentru a filtra răspunsurile adunate
- Data trimiterii:Afișată numai dacă timings este activat. Puteți filtra datele pe baza datei de trimitere a răspunsurilor dvs. colectate.
Pentru a obține răspunsurile filtrate numai în funcție de „filtrele generale”, activați opțiunea „Vizualizați rezumatul tuturor câmpurilor disponibile” și faceți clic pe butonul „Vizualizați statisticile” situat în partea din dreapta sus a ecran.
Filtre de răspuns
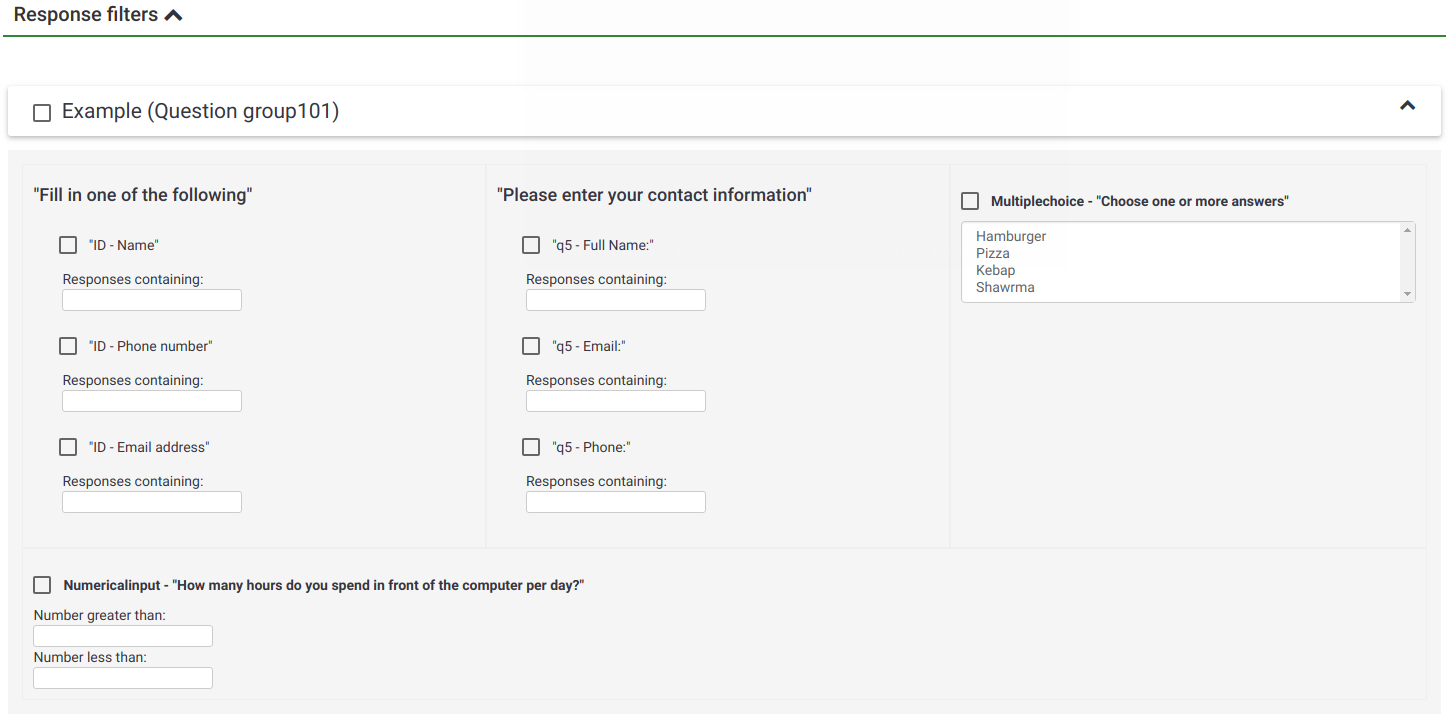
În funcție de tipul de întrebare utilizat, pot fi folosite diferite câmpuri pentru a filtra răspunsurile dvs.:
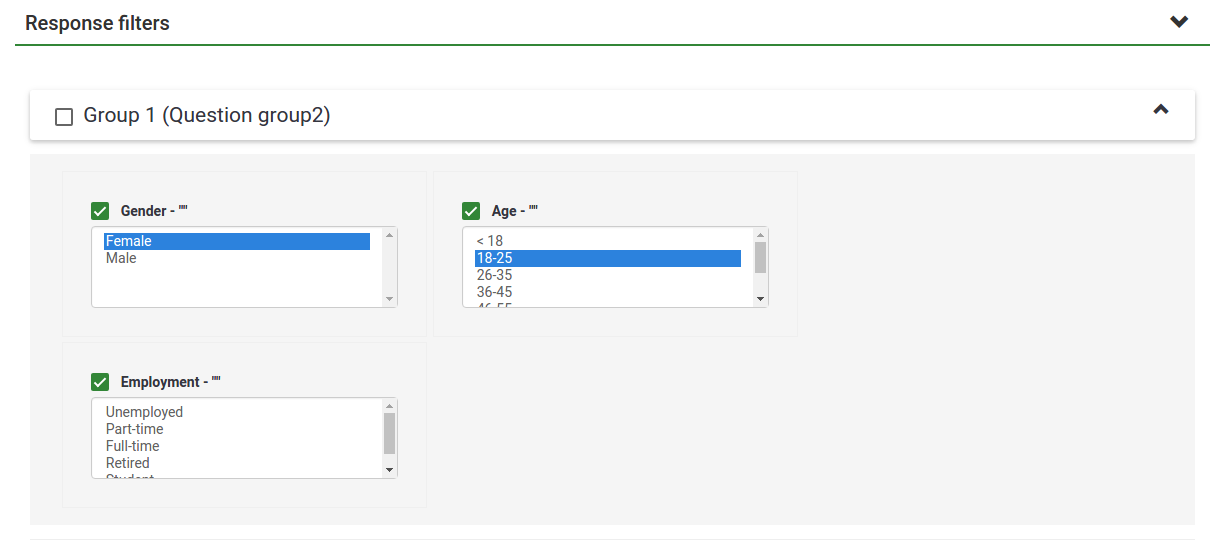
- După răspuns: Faceți clic pe unul sau mai multe răspunsuri din lista de sub fiecare întrebare pentru a filtra datele după acele răspunsuri (utilizați CTRL/clic pentru a selecta mai multe răspunsuri la aceeași întrebare). Rețineți că, dacă alegeți să vizualizați rezumatul tuturor câmpurilor disponibile (caseta de selectare în partea de sus), va trebui să selectați filtrele de răspuns înainte de a bifa caseta respectivă.
- După text:Puteți căuta răspunsurile la un tip de întrebare cu text liber (și tipuri similare) introducând un text. Dacă doriți să căutați un șir parțial, puteți utiliza semnul procentual (%) ca wildcard. De exemplu: Dacă căutați „Tom%”, va găsi intrări cu „Tomb” și „Tommy”, etc.
- După valoare numerică: Puteți căuta răspunsurile care conțin o anumită valoare numerică dacă sunt folosite tipuri de întrebări bazate pe numere.
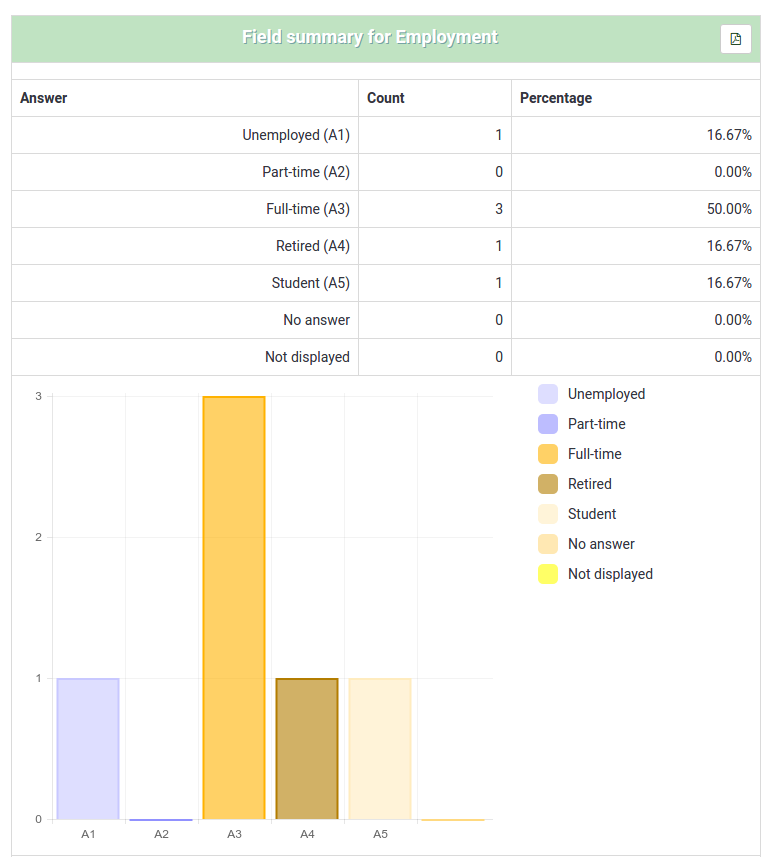
Selectarea „Vizualizare statistici” vă va oferi apoi tabelul „Rezultate”, indicând numărul de răspunsuri care corespund criteriilor dvs. și un tabel „Rezumat câmp” pentru fiecare întrebare selectată, care rezumă toate răspunsurile posibile în întrebările, totalurile și procentajul acestora. Este important să rețineți că aceste rezultate sunt un subset al răspunsurilor dvs. totale. Deci, de exemplu, dacă criteriile dvs. afișează 146 de înregistrări dintr-un total de 180, rezumatul va afișa doar defalcarea acelor 146 de înregistrări pentru acel tabel.
Imaginile de mai jos indică faptul că utilizatorul a ales să vadă statisticile pentru „Starea de angajare” a „înregistrărilor finalizate/femeie/vârsta 18-25”’’’’. Aceasta oferă rezultate pentru 6 din 13 înregistrări.

- Dacă setați criterii pentru aceeași întrebare pe care o cereți pentru un rezumat, atunci întrebarea respectivă va prezenta doar răspunsuri care corespund criteriilor dvs. Prin urmare, este o practică bună să „nu” să setați niciun criteriu pentru aceeași întrebare pentru care primiți un rezumat.
- Pentru a selecta mai multe intrări pentru o întrebare țineți apăsat butonul CTRL când faceți clic. Pentru a „deselecta” ultimele criterii (dacă doriți să ștergeți toate criteriile dintr-o întrebare) faceți clic pe răspunsul evidențiat respectiv în timp ce țineți apăsat butonul CTRL.
Grafice
For charting, the library pChart is used, which is completely included and usually doesn't have to be configured.
After the graphs have been generated you can export them easily. Right click on graph and choose "Save image as", then save the graph as a .png file to your chosen location.
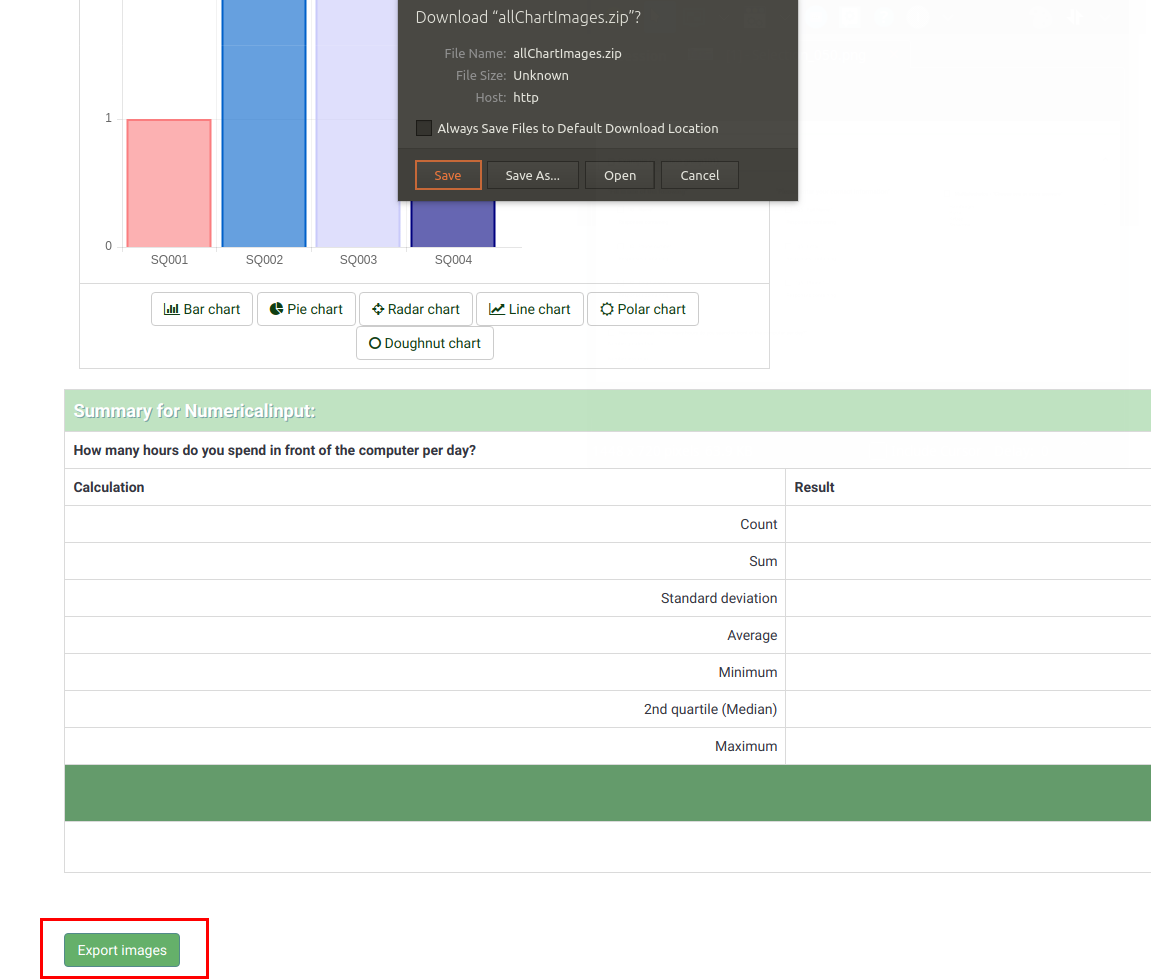
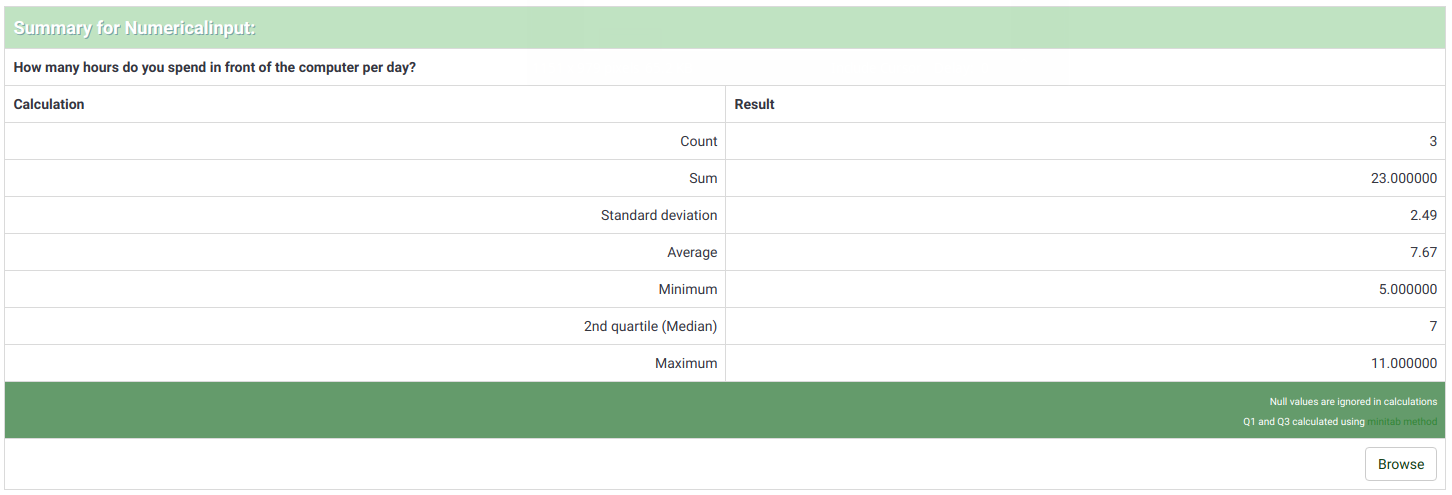
You can also use the "Export images" function to save all the graphs.
"Incomplete responses", "no answers" and "not completed/not displayed" count
- incomplete responses: All questions started but not completed - the participant clicked the "Next" button in the survey, but did not click the "Submit" button (did not land on the end page of your survey).
There is no SubmitDate in the response table for this entry, but new data set was created already.
- no answer: The question was displayed, but the participant did not an answer.
The question is not mandatory, was displayed, received no answer and the user clicked "Next" or "Submit". The consequence is that the database field for this answer is set to "" (empty string). This "no answer" status cannot be really computed for "Date" or pure "Numerical questions" where the database field cannot record a string.
- not completed/not displayed: The page containing the question was not displayed. This can be because of conditions, or because the participant left the survey before this page was displayed (or while this page is displayed, but without clicking the Next button).
The database field for this question is filled with a NULL value.
Output format and options
The statistics can be displayed in three different formats:
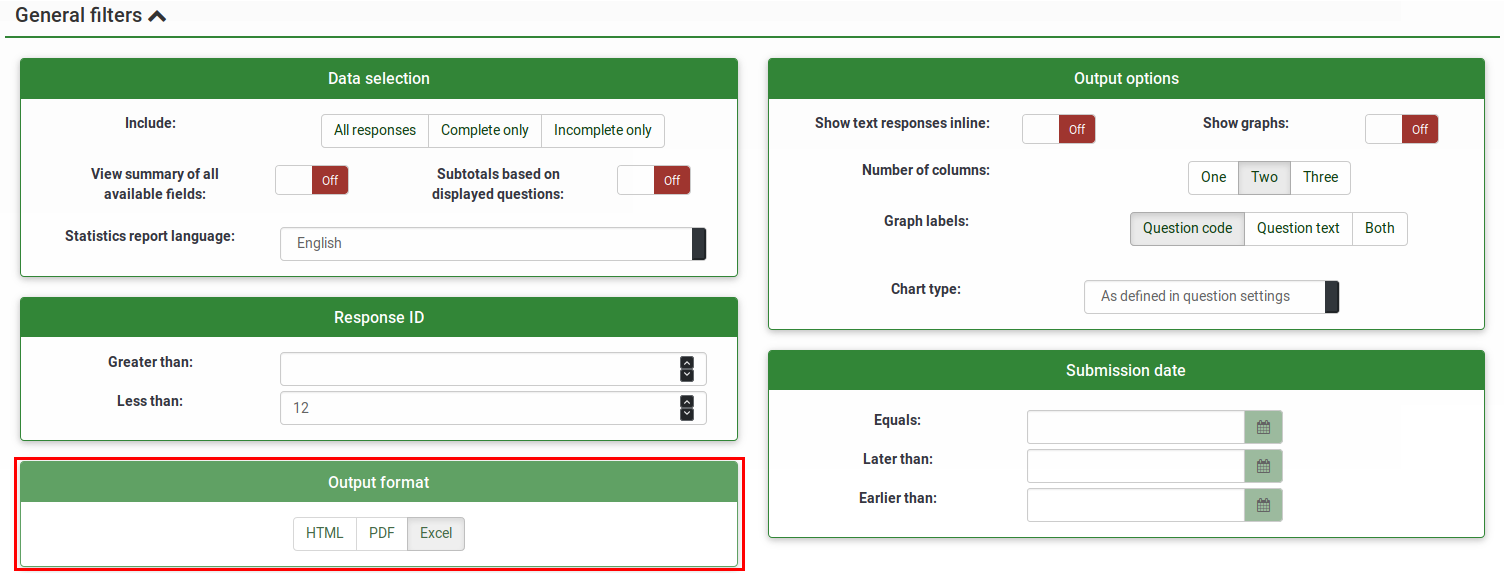
- HTML (default option): The statistics are displayed in LimeSurvey.
- PDF: A popup will be displayed, asking to save the statistics as a PDF file.
- Excel: To further work with your (filtered) data, choose Excel. You can export the file from a spreadsheet application to CSV to work with more advanced statistical tools such as SPSS or R.
The output options can be used to alter the way the statistics are displayed. The following options are available:
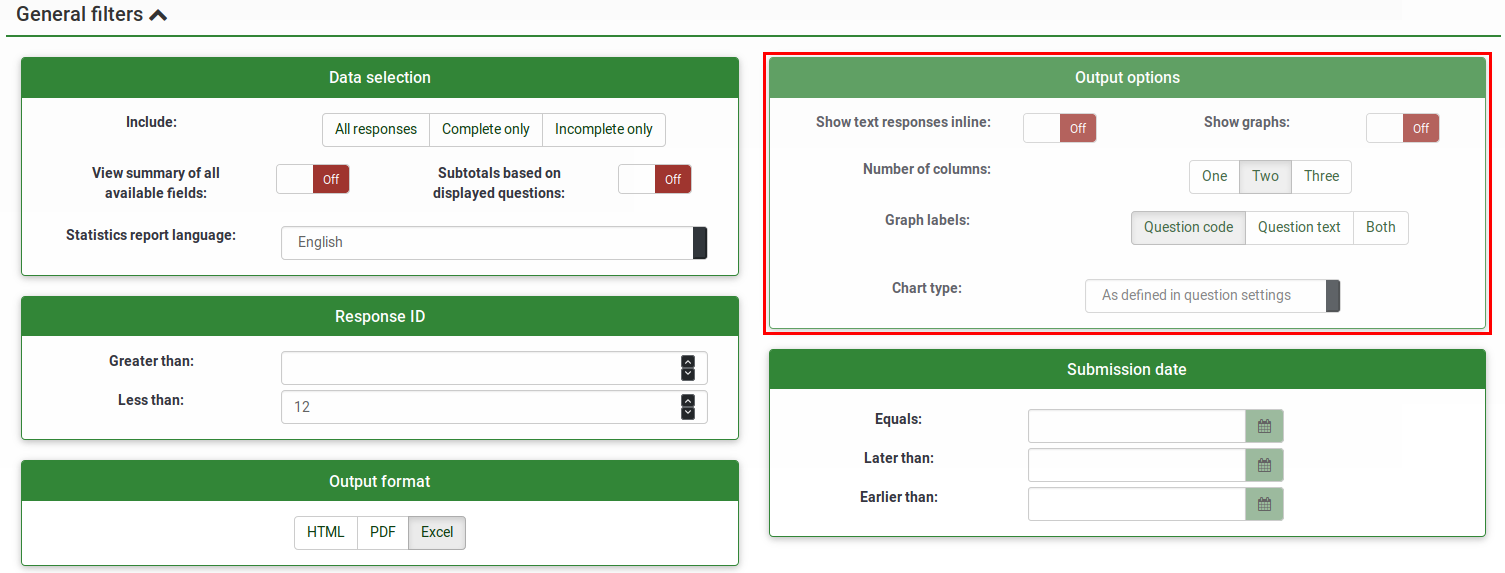
- Show text responses inline: Disabled by default. Shows the text questions responses without having to click a browse button (if enabled; useful for the HTML version of output format)
- Show graphs: Disabled by default. If enabled, graphs will be displayed.
- Number of columns: Two is the default number. If you wish to have statistics and graphs displayed on only one or three columns, choose the desired value from this option. It applies to HTML statistics.
- Graph labels: Choose how the label should look in the graph.
- Question code
- Question text
- Both
- Chart type: the following chart type settings are available:
- As defined in question settings: Useful if you do not want the graph to be displayed. If this is the case, deactivate it from the question settings and select from the "Statistics" panel this option.
- Bar chart
- Pie chart
- Radar chart
- Line chart
- Polar chart
- Doughnut chart
Embed custom logo at statistic PDF
If you want to embed your own logo to the statistics PDF, make sure a file specifically named "statistics.jpg" is placed within the "images" folder of the admin theme used for your system. The admin theme that you would like to use can be set in Global Settings.
Statistics - simple mode
The simple mode was created to provide simple bar chart statistics that can be quickly exported and saved, and then included into a presentation:
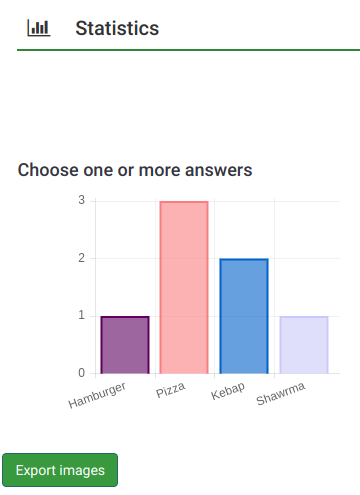
Fewer graphs are displayed than in the expert mode. While in the export mode you can display graphs with respect to those who filled out the survey, did not answer it or did not complete it. the simple mode displays only statistics that rely on the "countable" data submitted by the participants (e.g., single or multiple choice questions as well as array questions).
There is only one option to filter the data within the simple mode - via the responses to be included in the statistics. As a result, the statistics may include the complete responses, incomplete responses, or all responses (the aggregated sum of the first two options). This option is located in the upper-right part of the panel.
To switch back to expert mode, click the "Expert mode" button located in the upper-right part of the screen:

Public statistics
LimeSurvey includes the functionality to display simple statistics to the general public or to your participants after they have completed an online survey.
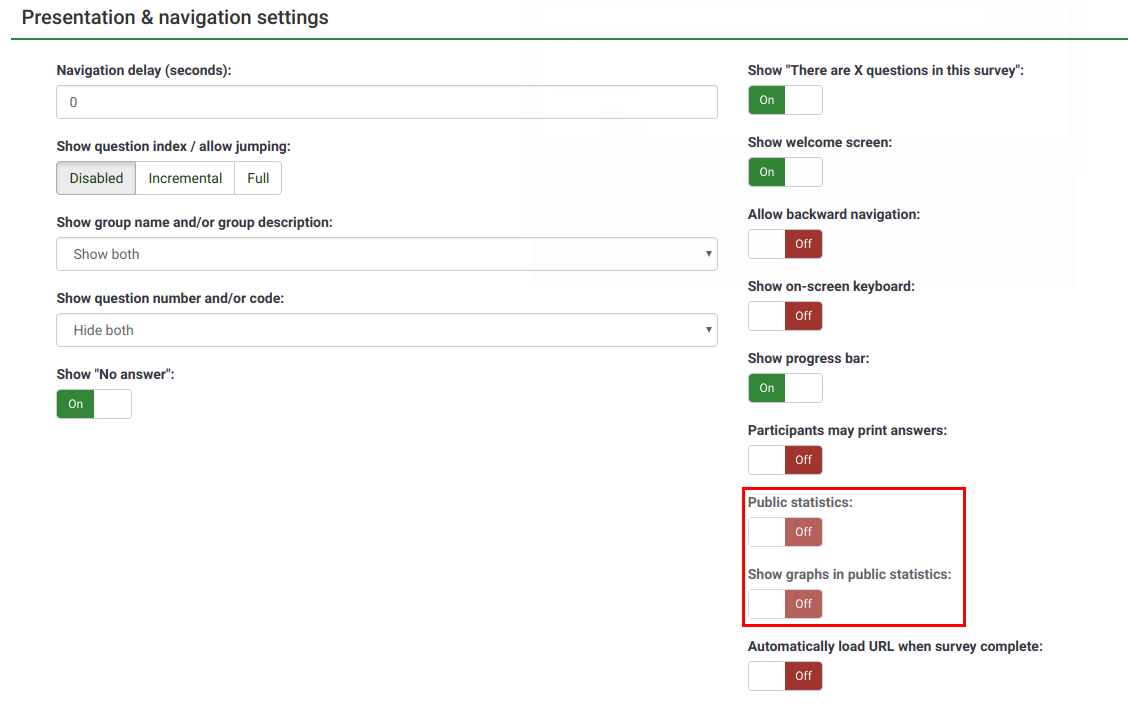
Two components need to be enabled to activate and display statistics to your participants. The first one refers to the public statistics of your survey which must be enabled (it is turned off by default). It is located under the Presentation tab. To also show graphs, look on the same page for the Show graphs in public statistics attribute and enable it (it is disabled by default).
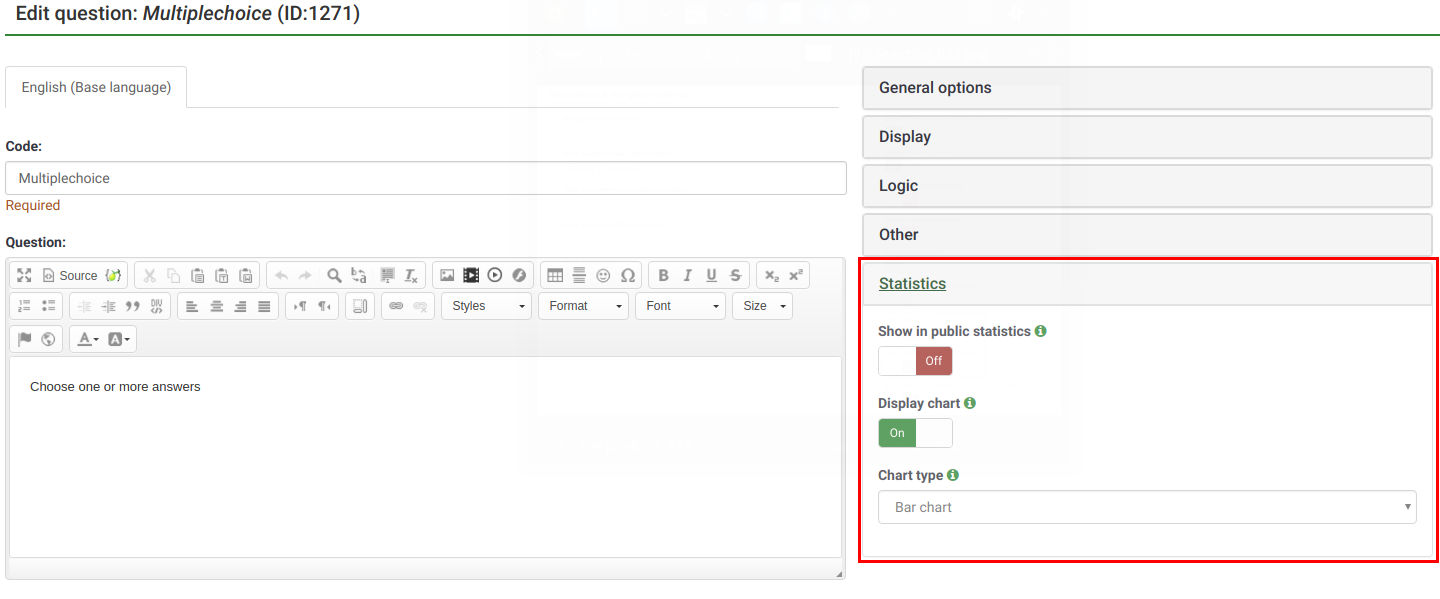
Once you have set your survey to display statistics, you need to indicate question-by-question which statistics you want to be displayed to your respondents. By default, no questions will be displayed. To have them displayed, access the desired question, look for the "Statistics" tab and enable the Show in public statistics attribute.
What participants see
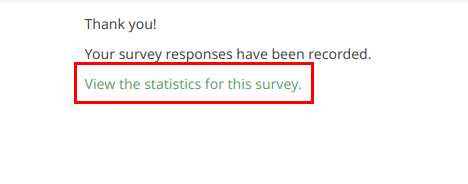
Once you have enabled public statistics and selected some questions to display, an additional option will be visible to participants when they complete your survey. In addition to the usual thank you, there will be a link to "View the statistics for this survey":
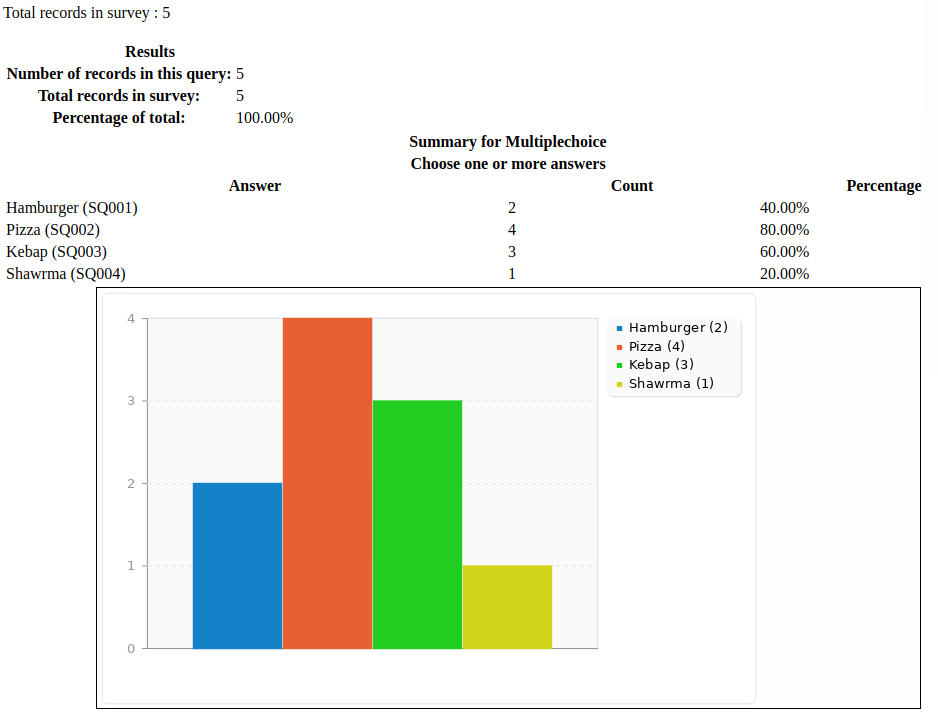
The survey statistics will be displayed on this page. Graphs can also be displayed by enabling the Display chart question attribute:
Changing the look of the public statistics page
The apprearance of the public statistics page can be modified via template.css (search for "#statsContainer"). However, there is currently no template on it's own that can be edited in the LimeSurvey theme editor.
Hints & tips
Feel free to edit the following wiki sections to let other LimeSurvey users learn about statistics-related hints & tips.
Wrong font when exporting statistics - what to do?
For some languages (like Chinese), the usual font used (Vera) does not cover the needed character set. In that case you can use the setting $chartfontfile to set a new TTF font file in config.php (Check out config-defaults.php for the right setting). For Chinese (Simplified and Traditional), another font has to be used such as the FireFlySung font which can be downloaded from github.
FAQs
5 Point choice question type - what do the values located under the "sum" column represent?
In the screenshot below, notice that the "Sum" column shows the aggregated values in the following way:
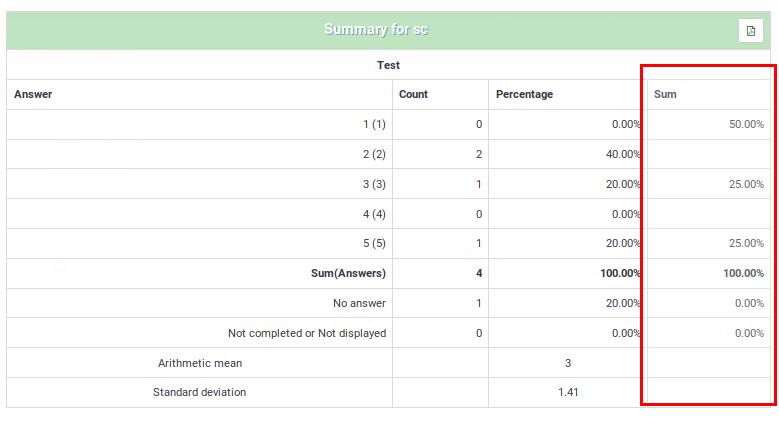
The grouping from the "Sum" column was done in this way because, when rating questions, survey administrators usually interpret the results in this way:
- Y percent of the participants DISLIKE item ABC, where Y represents the percentage of those who answered "1" and "2"
- X percent of the participants LIKE item ABC, where X represents the percentage of those who answered "4" and "5"
- Z percent of the participants have a NEUTRAL opinion about item ABC, where Z represents the percentage of those who answered "3"
| Answer | Count | Sum |
|---|---|---|
| 1 | 0 | 50% (the percentage of those who answered "1" and "2") |
| 2 | 2 | |
| 3 | 1 | 25% (the percentage of those who selected "3" - the neutral option) |
| 4 | 0 | |
| 5 | 1 | 25% (the sum of those who answered "4" and "5") |
| Sum (Answers) | 4 | 100% |
| No answer | 1 | 0% (always "0%") |
| Not completed or displayed | 0 | 0% (always "0%") |