Statisztika
From LimeSurvey Manual
Általános
A felmérés célja „válaszokat kapni a kérdésekre”. Miután létrehozta, aktiválta és meghívta a résztvevőket a felmérés kitöltésére, használhatja a Válaszok és statisztikák funkciót a felmérés eredményeinek összegyűjtésére és elemzésére, hogy válaszokat kapjon.
A statisztikai funkció egy aktív felmérés válaszmenüje alatt található: Válaszok > Válaszok és statisztikák Válaszok csak akkor érhető el, ha egy felmérés aktiválva van.

Kattintson a "Statisztika" elemre a felső eszköztáron.

A következő oldal jelenik meg.

A LimeSurvey statisztikák szakértői módban vagy egyszerű módban jeleníthetők meg. Alapértelmezés szerint a szakértői mód jelenik meg, ha rákattint a Statisztika
Statisztika – szakértői mód
A felmérés befejeződött, és most szeretné elkezdeni az eredmények elemzését. A LimeSurvey az összes eredményt Excel-táblázatba vagy CSV-fájlba exportálhatja.
A statisztikai – szakértői mód funkció lehetővé teszi az adatok „szűrését”, valamint a különböző mezők számainak és összegzésének lekérését. A statisztikai szkript nem végez túl bonyolult szűrést, de sok nagyon hasznos információ található, amelyek könnyen beszerezhetők.
Gyors statisztika futtatása
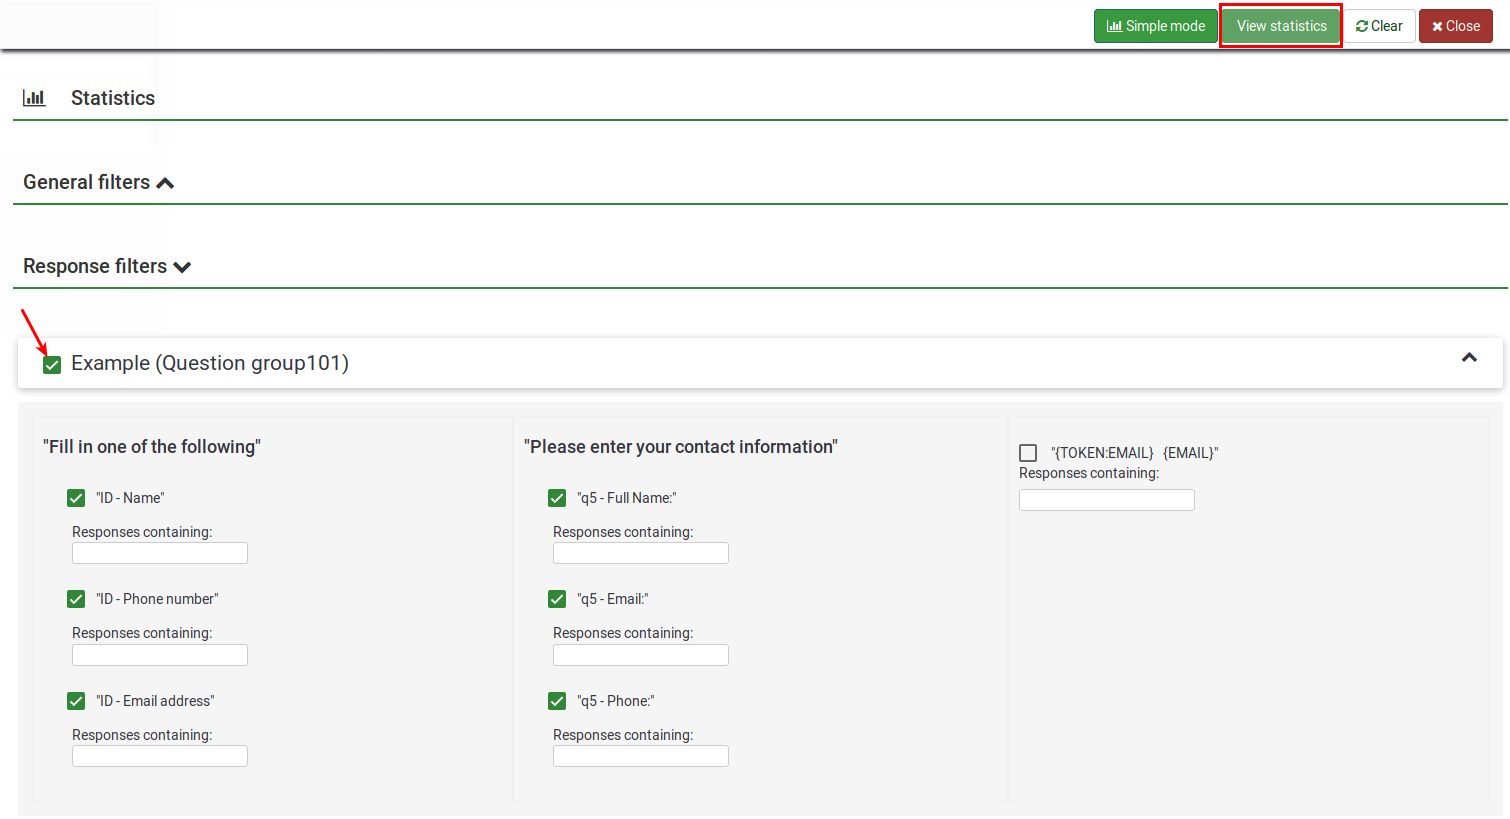
Az alábbi képernyőképen láthatja, hogy minden kérdéshez van egy jelölőnégyzet, amelyet be lehet jelölni, hogy megjelenjen az egyes kérdésekre adott válaszösszegzés, valamint egy ikon, amelyre kattintva (vagy ha az egérmutató fölé kerül) megjelenik a a kérdés teljes szövege. Egy kérdés vagy kérdések eredményeinek megtekintéséhez jelölje be a kérdés(ek) tetején található jelölőnégyzet(eke)t, majd kattintson a "Statisztikák megtekintése" gombra.
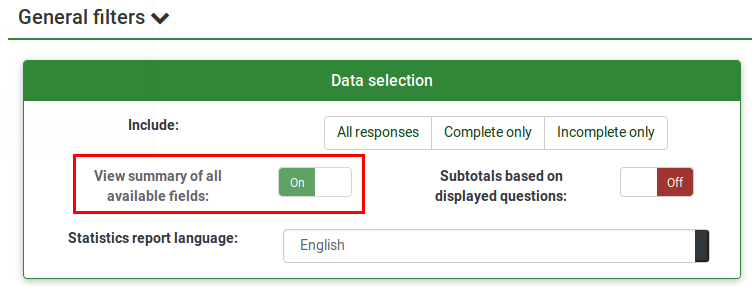
Alternatív megoldásként az összes elérhető kérdés eredményeinek megtekintéséhez engedélyezze az "Összes elérhető mező összegzésének megtekintése" lehetőséget, majd kattintson a "Statisztikák megtekintése" gombra.
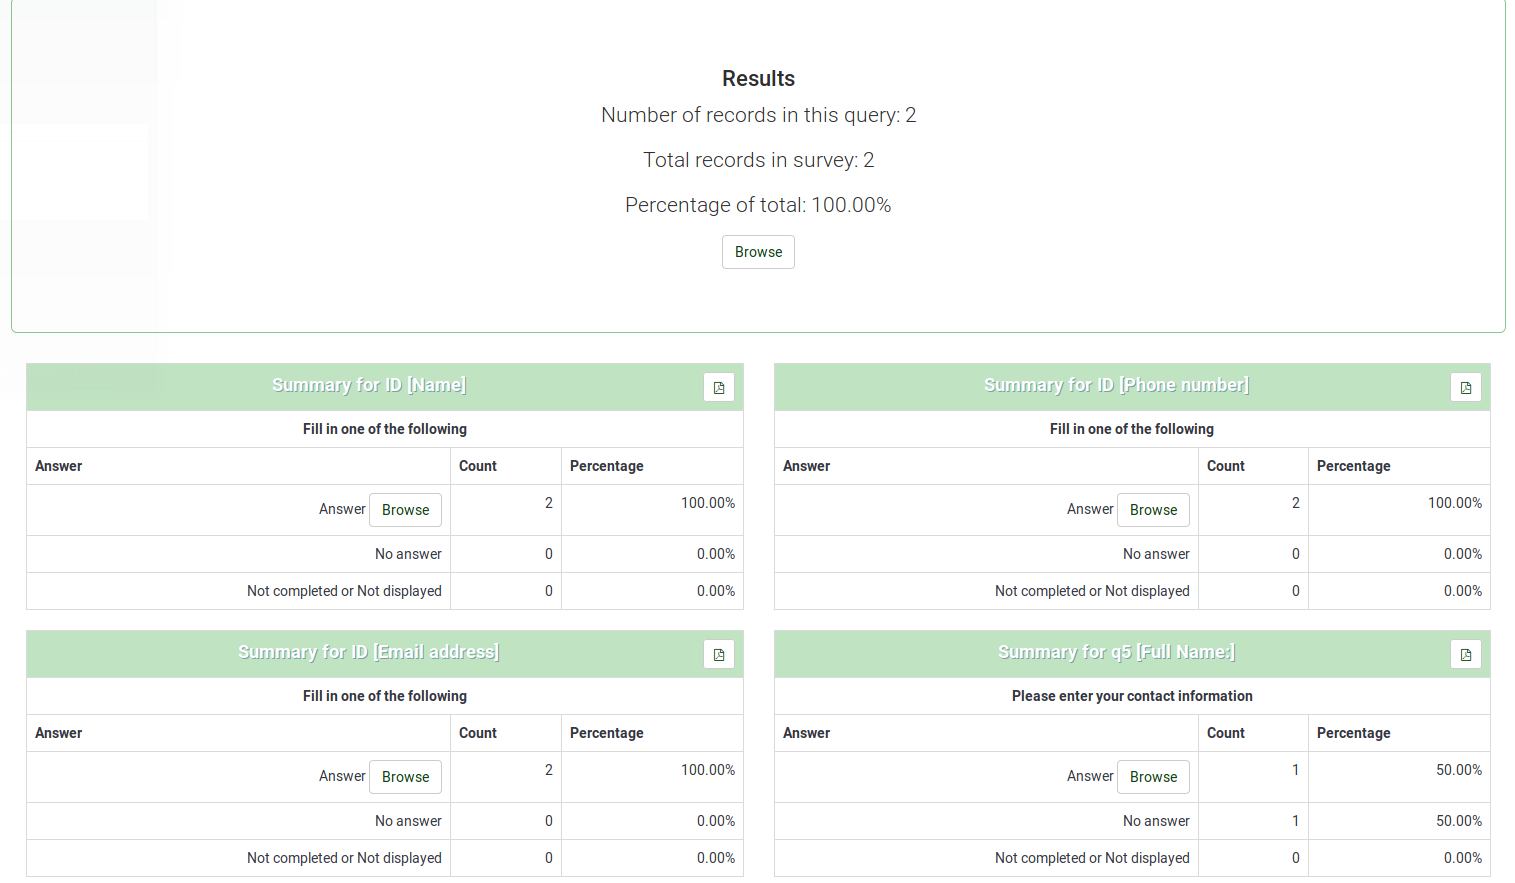
Ezután kap egy "Eredmények" táblázatot, amely jelzi az esetek számát, és egy "Mező összefoglaló" táblázatot minden egyes kiválasztott kérdéshez, amely összefoglalja a kérdés(ek)ben szereplő összes lehetséges választ, azok összegét és a hozzájuk tartozókat. százalék.
Adatok szűrése
Kétféle szűrő létezik: általános és response filters.
Általános szűrők
Ahogy a neve is sugallja, az „Általános szűrők” általános (makró) szintű szűrőkre utalnak.
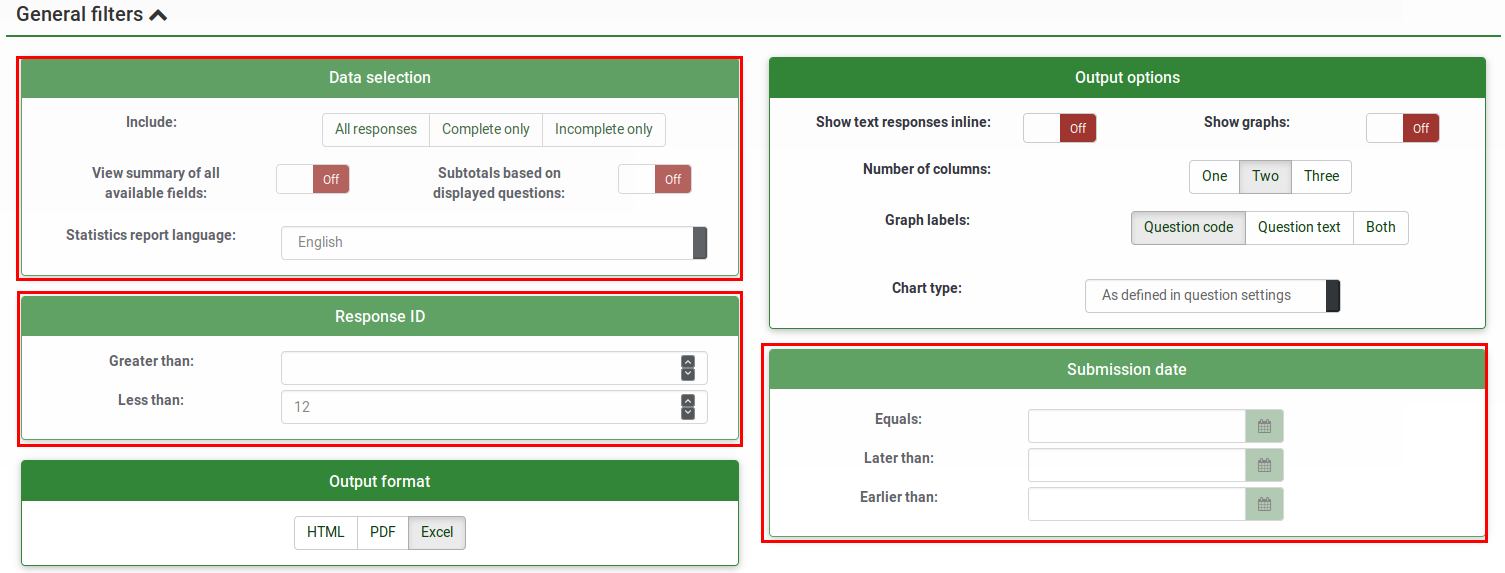
A szűrők a következőkhöz kapcsolódhatnak:
- 'Adatkiválasztás
- A válaszok típusa:
- Teljes válaszok: a beküldési dátumot tartalmazó válaszok
- Hiányos válaszok: olyan válaszok, amelyek igen nem tartalmaz beküldési dátumot
- Minden rekord: a teljes és hiányos válaszok összesített száma.
- A statisztikai jelentés nyelve: további nyelvek használata esetén ez a szűrő opció hasznos a résztvevők felosztásához a kérdőív kitöltéséhez használt nyelv alapján töltse ki.
- A válaszok típusa:
- Az összes elérhető mező összegzésének megtekintése: Alapértelmezés szerint ki van kapcsolva. Engedélyezésével az összes felmérési kérdés és csoport figyelembe lesz véve a statisztikai szkript futtatásakor
- Részösszegek a megjelenített kérdések alapján: Alapértelmezés szerint deaktiválva. Az egyes kérdésekre vonatkozó statisztikákat csak azon válaszok teljes száma alapján számolja, amelyekre a kérdés megjelent (jó módszer a befejezetlen/befejezetlen válaszok szűrésére).
- Válaszazonosító: Az azonosító szám segítségével szűrje ki az összegyűjtött válaszokat
- Beküldés dátuma:Csak akkor jelenik meg, ha a timings engedélyezve van. Az adatokat az összegyűjtött válaszok beküldési dátuma alapján szűrheti.
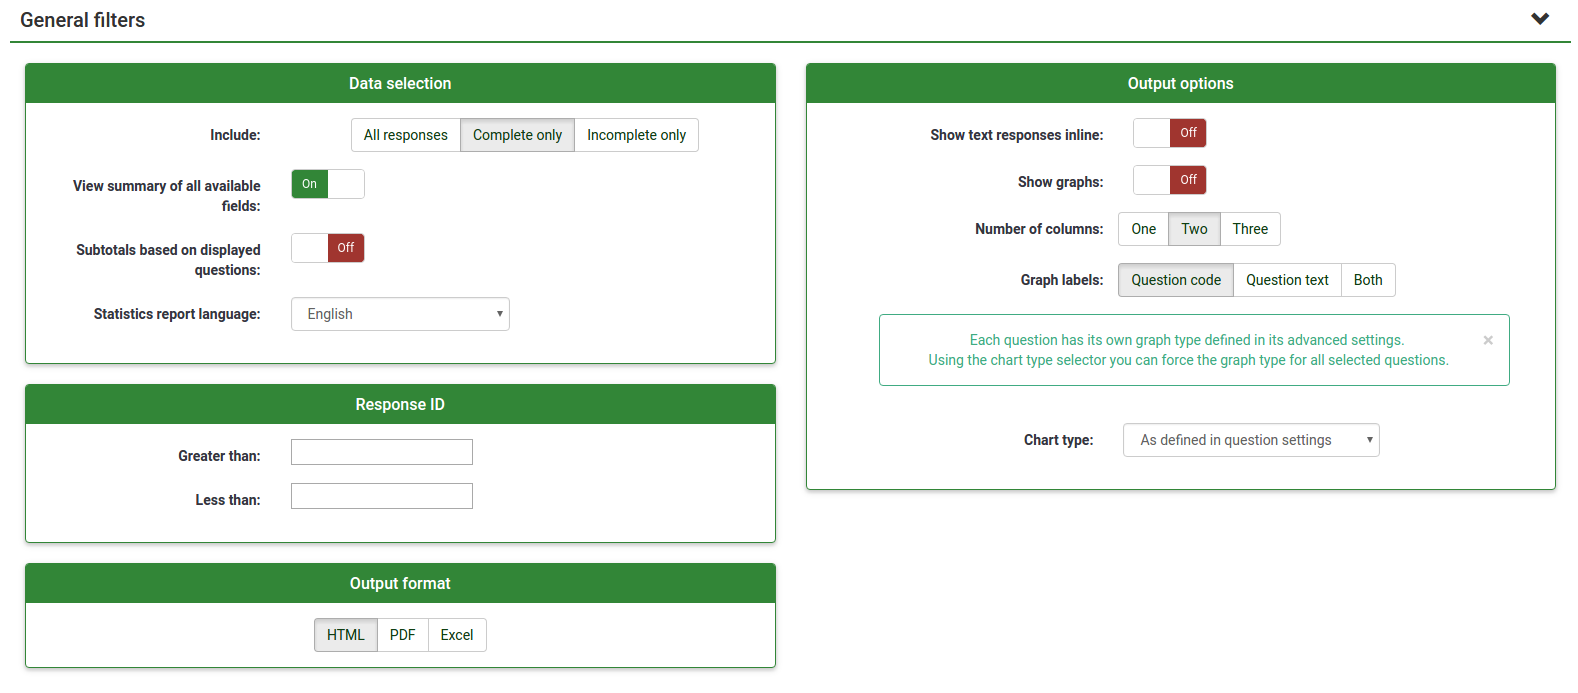
Ha a válaszokat csak az általános szűrők szerint szeretné szűrni, engedélyezze az "Összes elérhető mező összegzésének megtekintése" opciót, majd kattintson a "Statisztikák megtekintése" gombra, amely a képernyő jobb felső részén található. képernyő.
Válaszszűrők
A használt kérdéstípus függvényében különböző mezők használhatók a válaszok szűrésére:
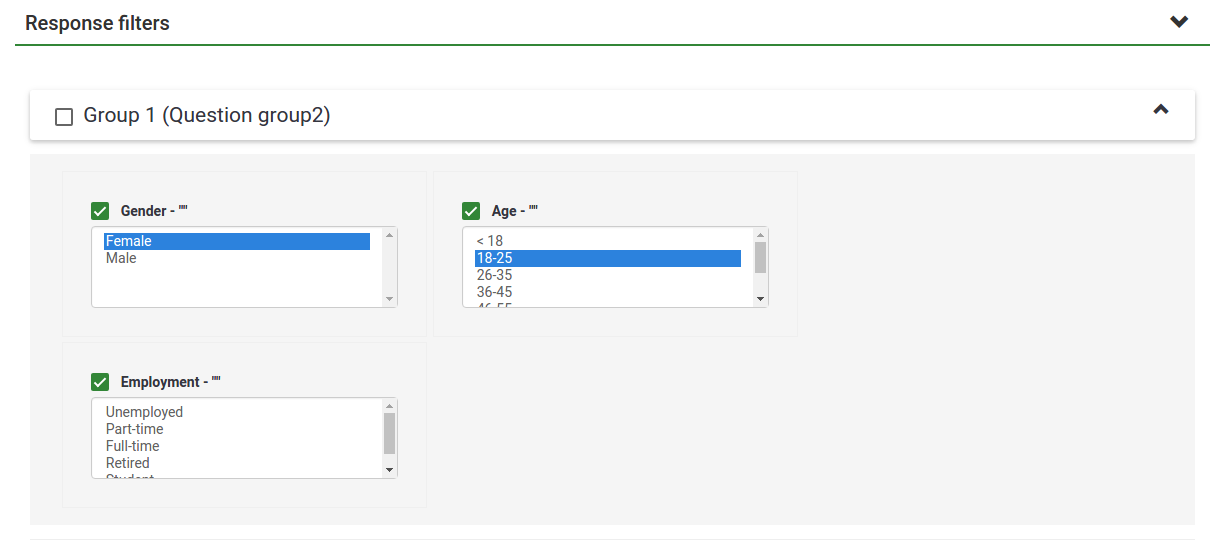
- Válasz szerint:' Kattintson egy vagy több válaszra a listában az egyes kérdések alatt, hogy az adott válaszok alapján szűrje az adatokat (a CTRL/kattintás billentyűkombinációval ugyanabban a kérdésben több választ is kijelölhet). Vegye figyelembe, hogy ha úgy dönt, hogy megtekinti az összes rendelkezésre álló mező összegzését (felül jelölőnégyzet), akkor a jelölőnégyzet bejelölése előtt ki kell választania a válaszszűrőket.
- Szöveg szerint:Szöveg beírásával kereshet egy szabad szöveges kérdéstípusra (és hasonló típusokra) a válaszok között. Ha részleges karakterláncot szeretne keresni, használhatja a százalékjelet (%) helyettesítő karakterként. Pl.: Ha rákeresel a 'Tom%'-ra, akkor megtalálja a 'Tomb' és 'Tommy' bejegyzéseket stb.
- Numerikus érték szerint: Ha számalapú kérdéstípust használunk, az adott számértéket tartalmazó válaszok között kereshet.
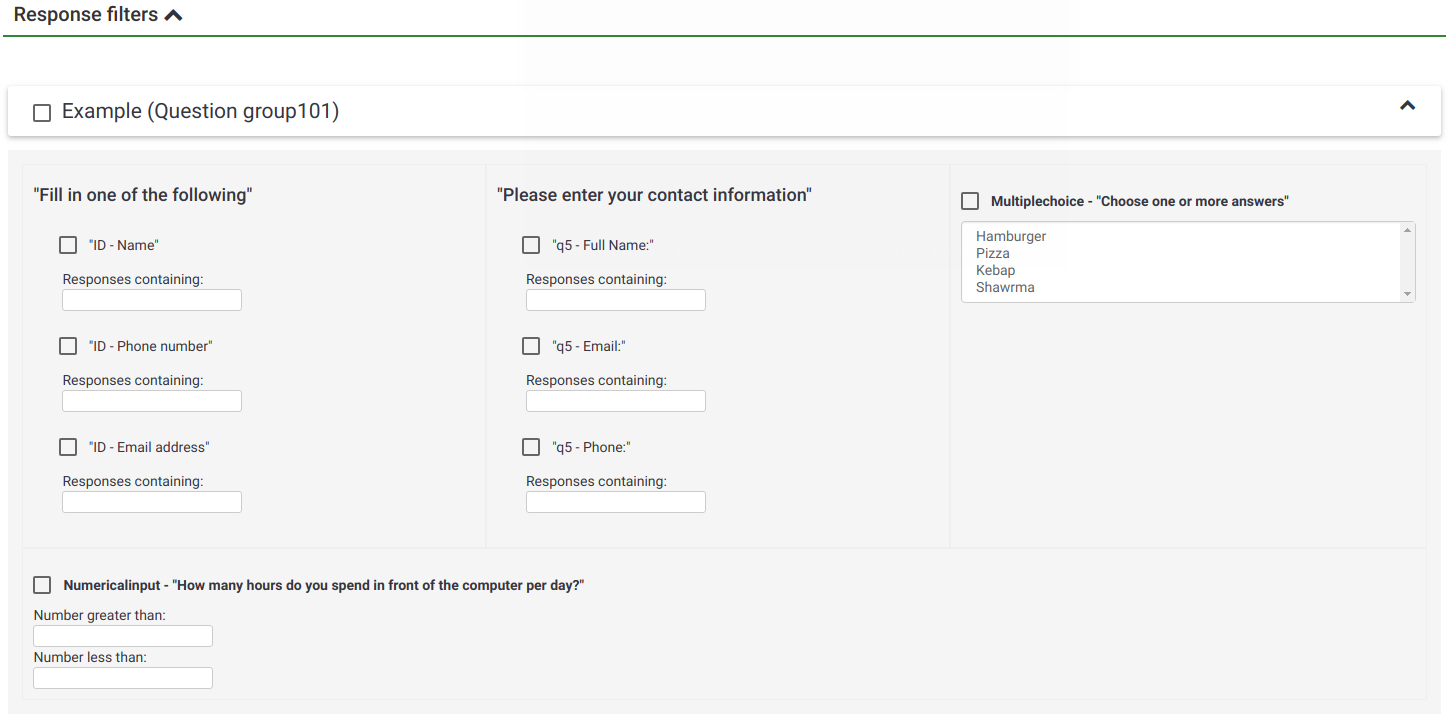
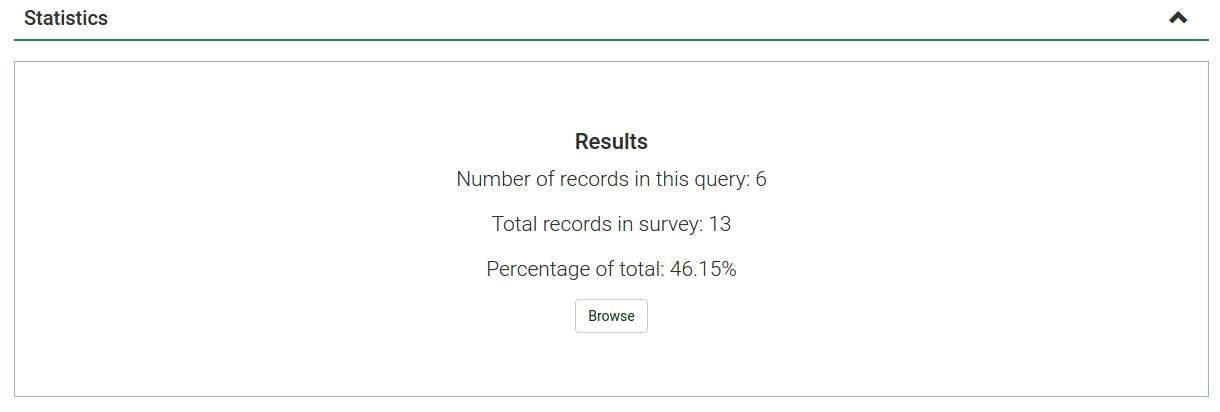
Selecting View statistics will then give you the Results table, indicating the number of responses matching your criteria, and a Field Summary table for each question selected which summarizes all possible answers in the question(s), their totals and their percentage. It is important to note that these results are a subset of your total responses. So, for example, if your criteria display 146 records out of a total 180, the summary will show the breakdown of just those 146 records for that table.
The images below indicate that the user has elected to view the stats for "Employment status" of completed records/female/age 18-25. This gives returns the results for 6 out of 13 records.
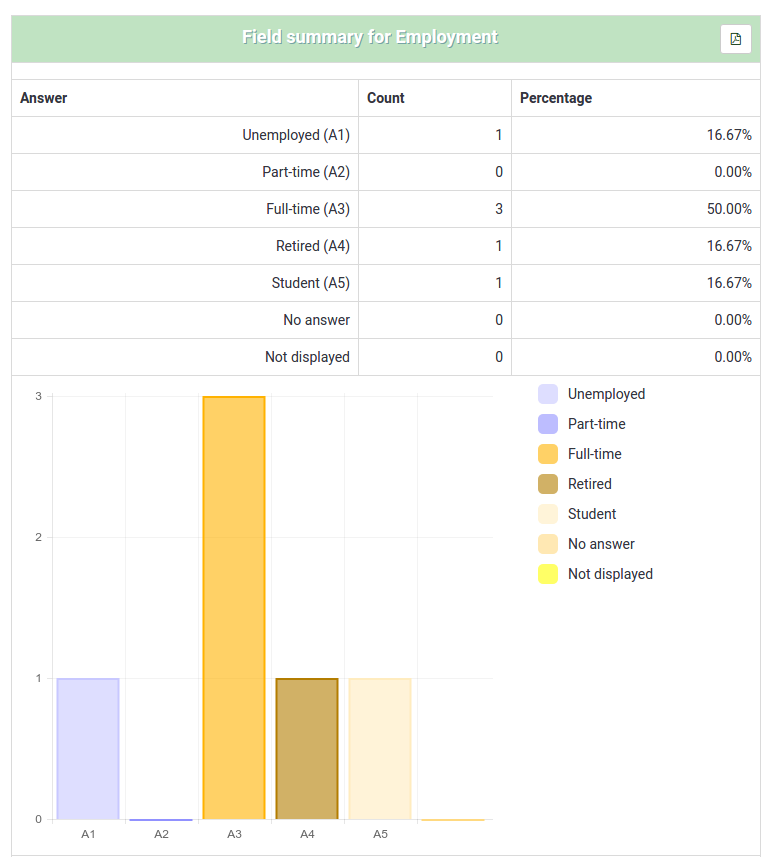
- If you set criteria on the same question that you ask for a summary, then that question will only present answers matching your criteria. So it is good practice not to set any criteria on the same question you are getting a summary of.
- To select multiple entries for a question hold down the CTRL button when clicking. To "unselect" the last criteria (if you want to clear all criteria from a question) click on the respective highlighted answer while holding pressed the CTRL button.
Graphs
For charting, the library pChart is used, which is completely included and usually doesn't have to be configured.
After the graphs have been generated you can export them easily. Right click on graph and choose "Save image as", then save the graph as a .png file to your chosen location.
You can also use the "Export images" function to save all the graphs.
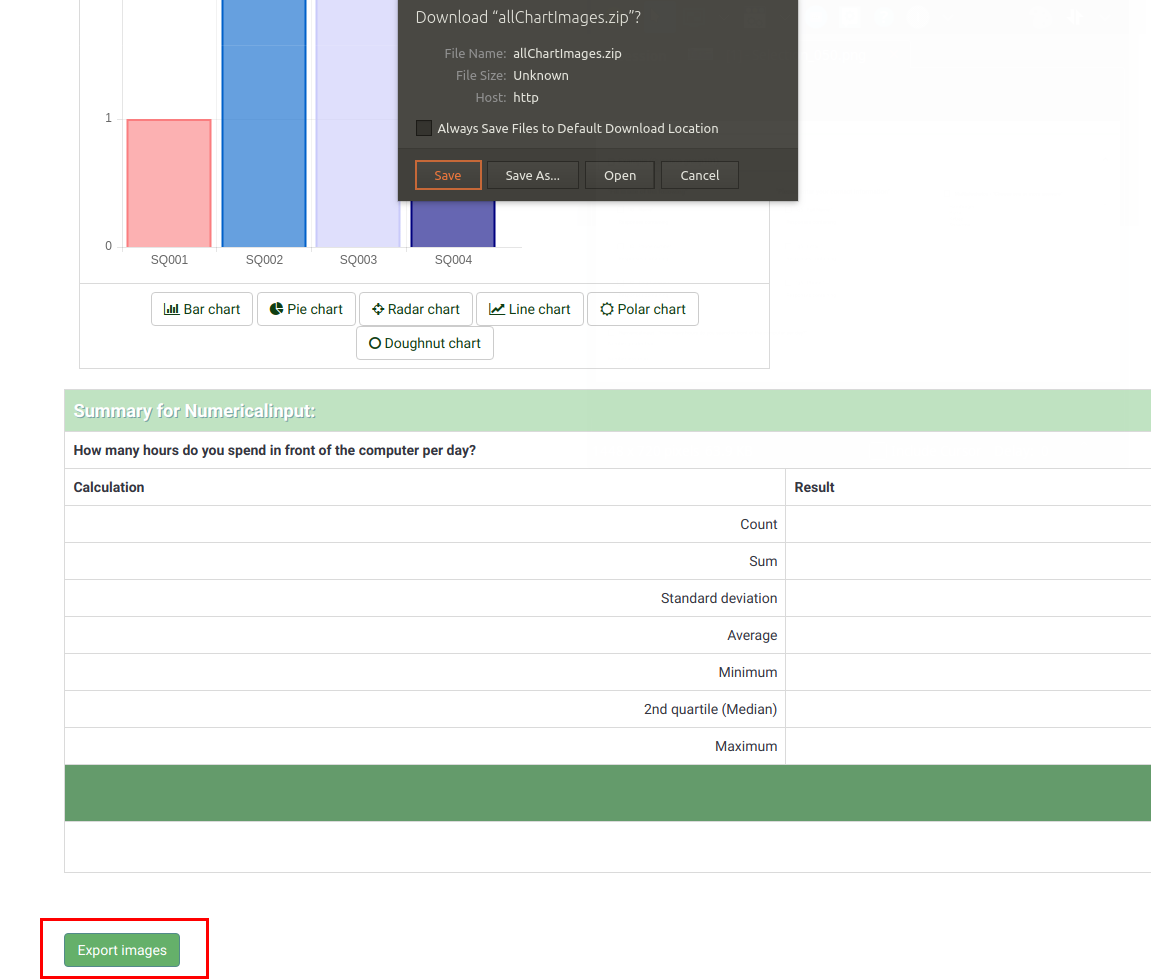
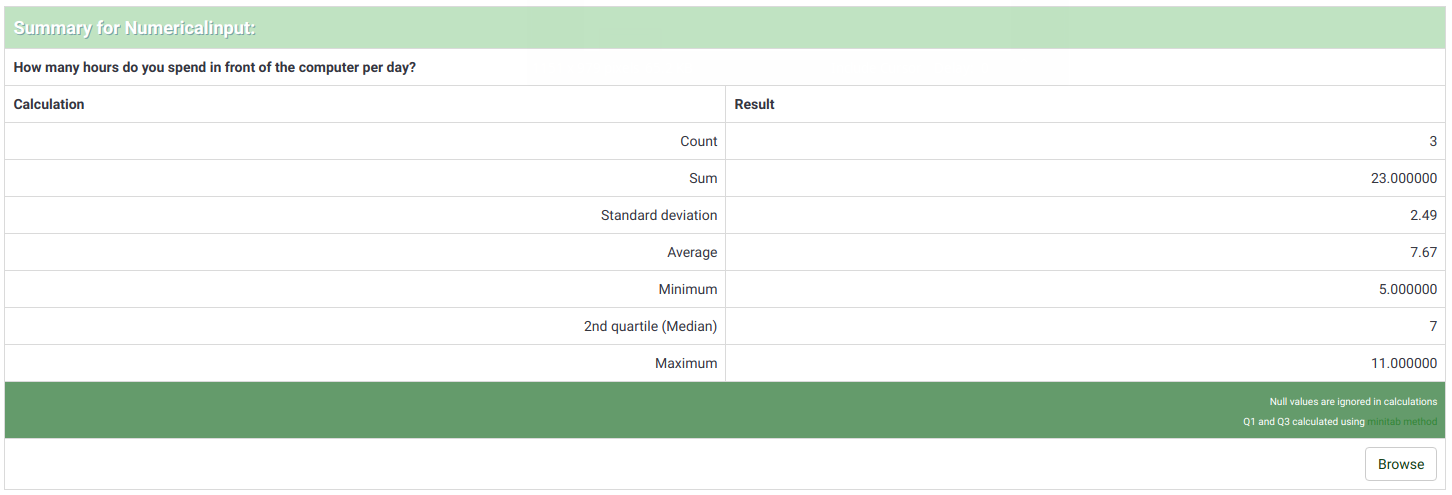
"Incomplete responses", "no answers" and "not completed/not displayed" count
- incomplete responses: All questions started but not completed - the participant clicked the "Next" button in the survey, but did not click the "Submit" button (did not land on the end page of your survey).
There is no SubmitDate in the response table for this entry, but new data set was created already.
- no answer: The question was displayed, but the participant did not an answer.
The question is not mandatory, was displayed, received no answer and the user clicked "Next" or "Submit". The consequence is that the database field for this answer is set to "" (empty string). This "no answer" status cannot be really computed for "Date" or pure "Numerical questions" where the database field cannot record a string.
- not completed/not displayed: The page containing the question was not displayed. This can be because of conditions, or because the participant left the survey before this page was displayed (or while this page is displayed, but without clicking the Next button).
The database field for this question is filled with a NULL value.
Output format and options
The statistics can be displayed in three different formats:
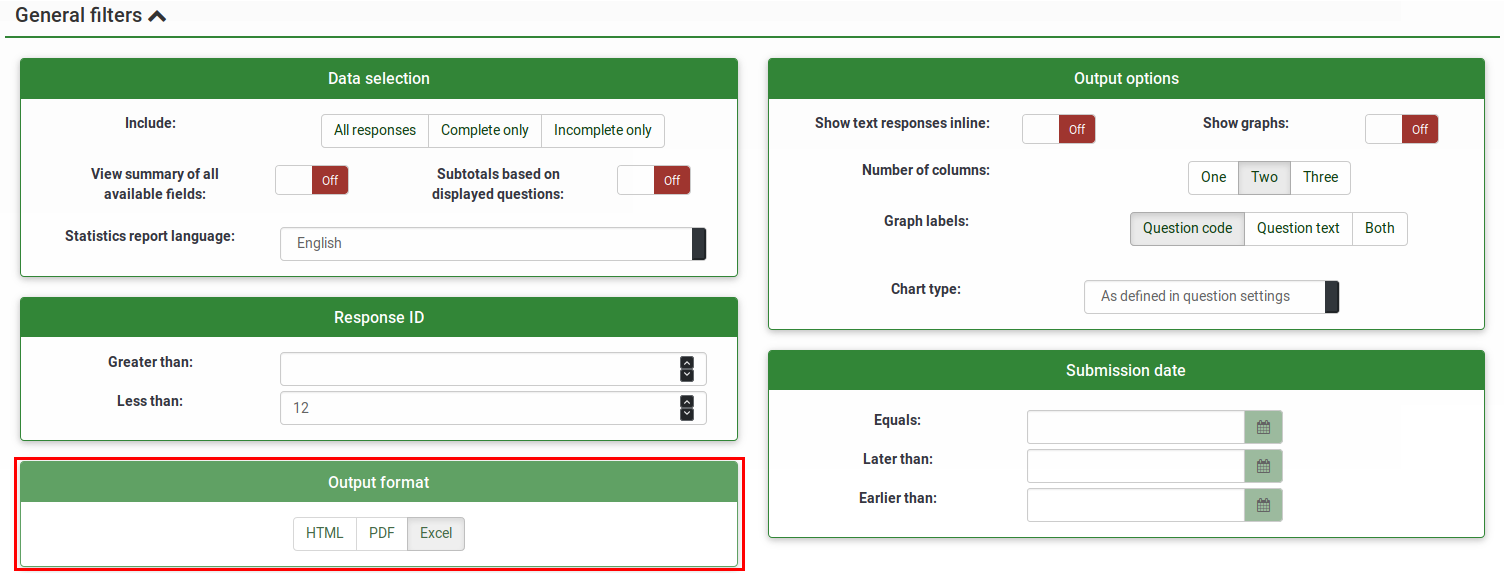
- HTML (default option): The statistics are displayed in LimeSurvey.
- PDF: A popup will be displayed, asking to save the statistics as a PDF file.
- Excel: To further work with your (filtered) data, choose Excel. You can export the file from a spreadsheet application to CSV to work with more advanced statistical tools such as SPSS or R.
The output options can be used to alter the way the statistics are displayed. The following options are available:
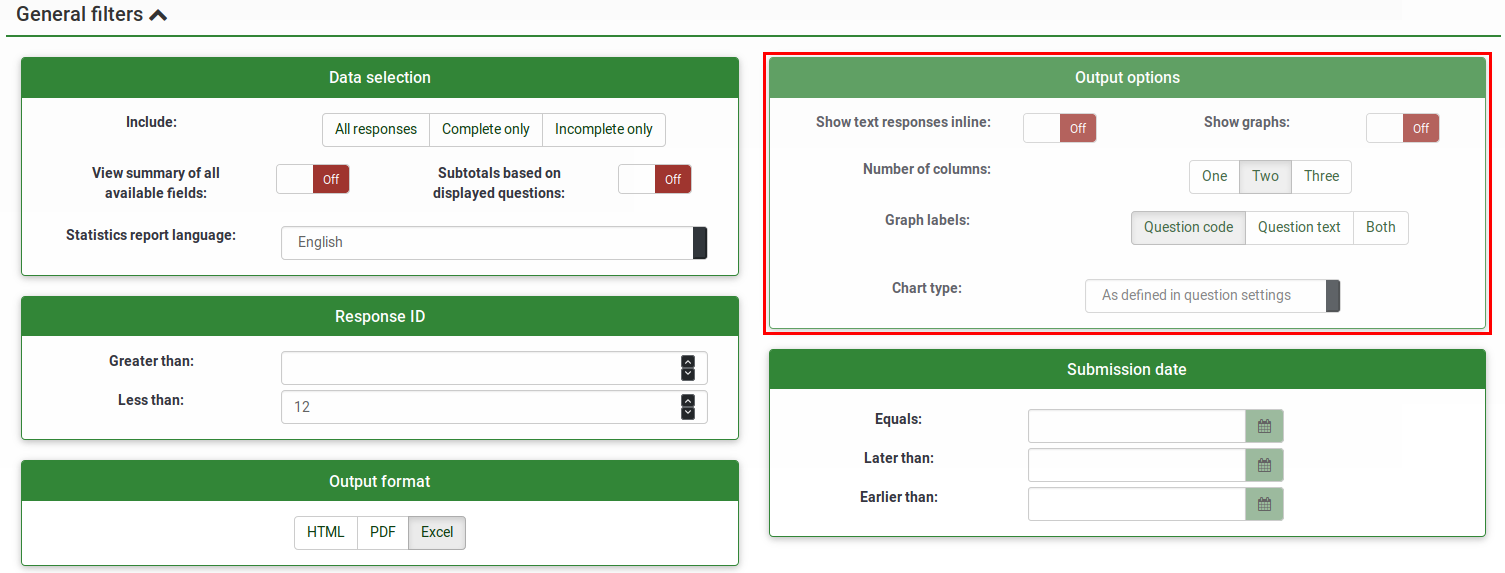
- Show text responses inline: Disabled by default. Shows the text questions responses without having to click a browse button (if enabled; useful for the HTML version of output format)
- Show graphs: Disabled by default. If enabled, graphs will be displayed.
- Number of columns: Two is the default number. If you wish to have statistics and graphs displayed on only one or three columns, choose the desired value from this option. It applies to HTML statistics.
- Graph labels: Choose how the label should look in the graph.
- Question code
- Question text
- Both
- Chart type: the following chart type settings are available:
- As defined in question settings: Useful if you do not want the graph to be displayed. If this is the case, deactivate it from the question settings and select from the "Statistics" panel this option.
- Bar chart
- Pie chart
- Radar chart
- Line chart
- Polar chart
- Doughnut chart
Embed custom logo at statistic PDF
If you want to embed your own logo to the statistics PDF, make sure a file specifically named "statistics.jpg" is placed within the "images" folder of the admin theme used for your system. The admin theme that you would like to use can be set in Global Settings.
Statistics - simple mode
The simple mode was created to provide simple bar chart statistics that can be quickly exported and saved, and then included into a presentation:
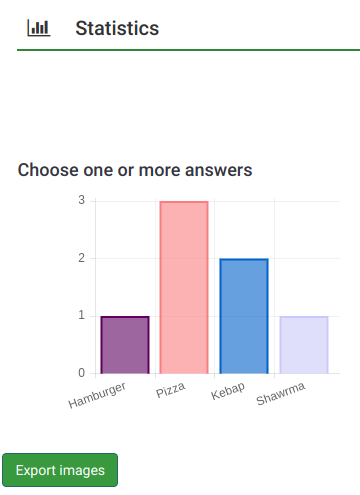
Fewer graphs are displayed than in the expert mode. While in the export mode you can display graphs with respect to those who filled out the survey, did not answer it or did not complete it. the simple mode displays only statistics that rely on the "countable" data submitted by the participants (e.g., single or multiple choice questions as well as array questions).
There is only one option to filter the data within the simple mode - via the responses to be included in the statistics. As a result, the statistics may include the complete responses, incomplete responses, or all responses (the aggregated sum of the first two options). This option is located in the upper-right part of the panel.
To switch back to expert mode, click the "Expert mode" button located in the upper-right part of the screen:

Public statistics
LimeSurvey includes the functionality to display simple statistics to the general public or to your participants after they have completed an online survey.
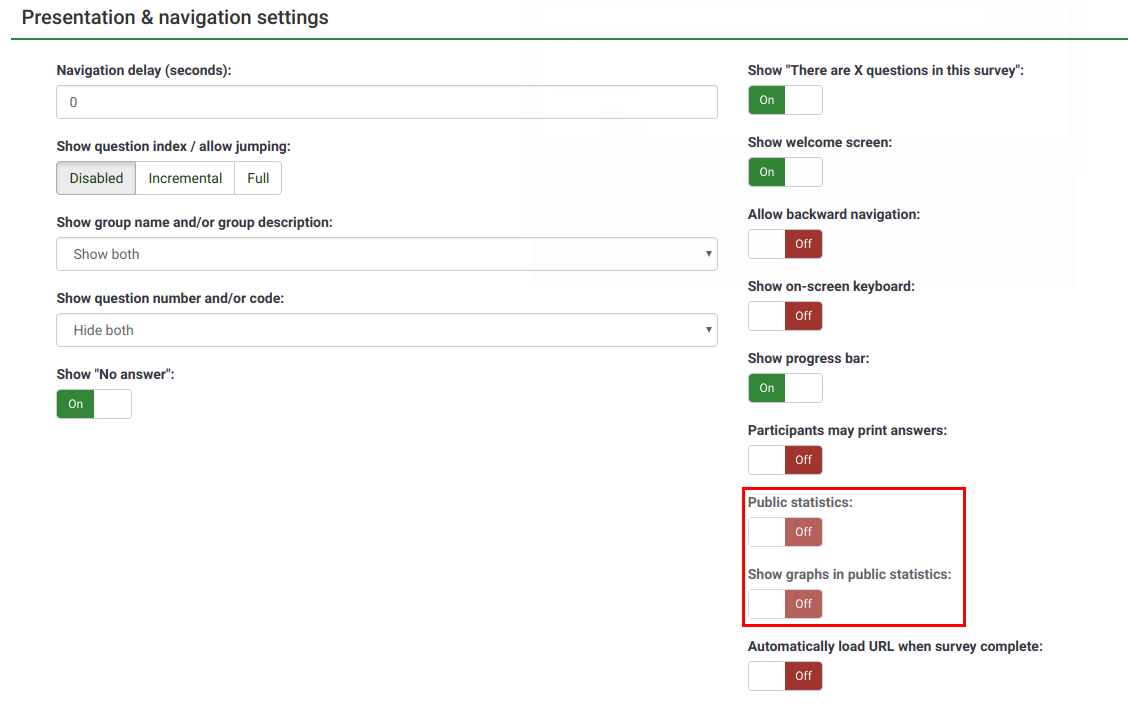
Two components need to be enabled to activate and display statistics to your participants. The first one refers to the public statistics of your survey which must be enabled (it is turned off by default). It is located under the Presentation tab. To also show graphs, look on the same page for the Show graphs in public statistics attribute and enable it (it is disabled by default).
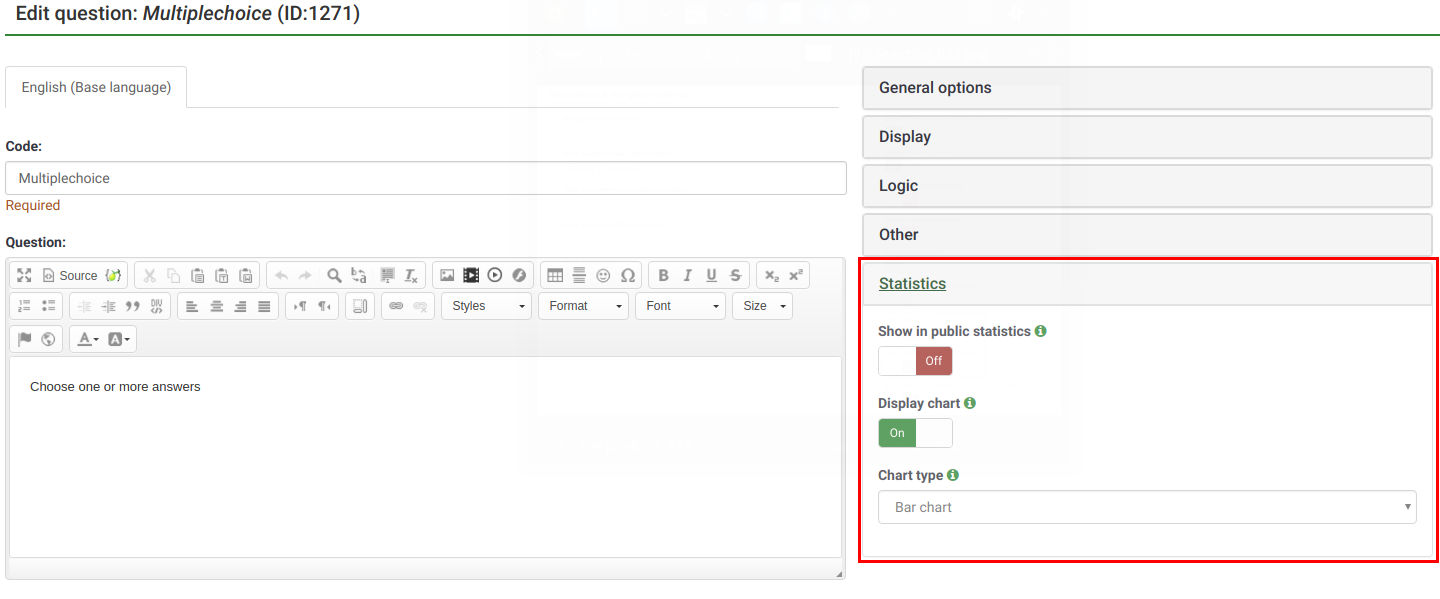
Once you have set your survey to display statistics, you need to indicate question-by-question which statistics you want to be displayed to your respondents. By default, no questions will be displayed. To have them displayed, access the desired question, look for the "Statistics" tab and enable the Show in public statistics attribute.
What participants see
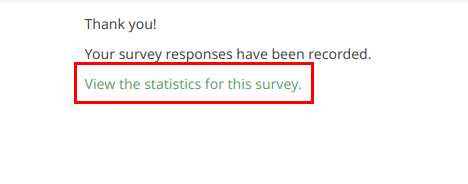
Once you have enabled public statistics and selected some questions to display, an additional option will be visible to participants when they complete your survey. In addition to the usual thank you, there will be a link to "View the statistics for this survey":
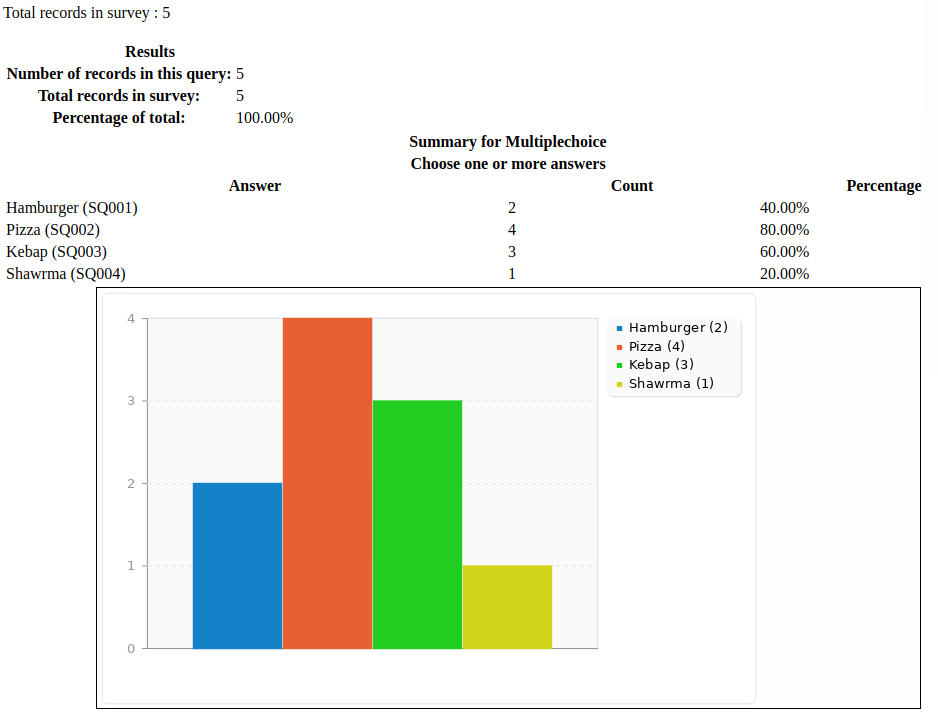
The survey statistics will be displayed on this page. Graphs can also be displayed by enabling the Display chart question attribute:
Changing the look of the public statistics page
The apprearance of the public statistics page can be modified via template.css (search for "#statsContainer"). However, there is currently no template on it's own that can be edited in the LimeSurvey theme editor.
Hints & tips
Feel free to edit the following wiki sections to let other LimeSurvey users learn about statistics-related hints & tips.
Wrong font when exporting statistics - what to do?
For some languages (like Chinese), the usual font used (Vera) does not cover the needed character set. In that case you can use the setting $chartfontfile to set a new TTF font file in config.php (Check out config-defaults.php for the right setting). For Chinese (Simplified and Traditional), another font has to be used such as the FireFlySung font which can be downloaded from github.
FAQs
5 Point choice question type - what do the values located under the "sum" column represent?
In the screenshot below, notice that the "Sum" column shows the aggregated values in the following way:
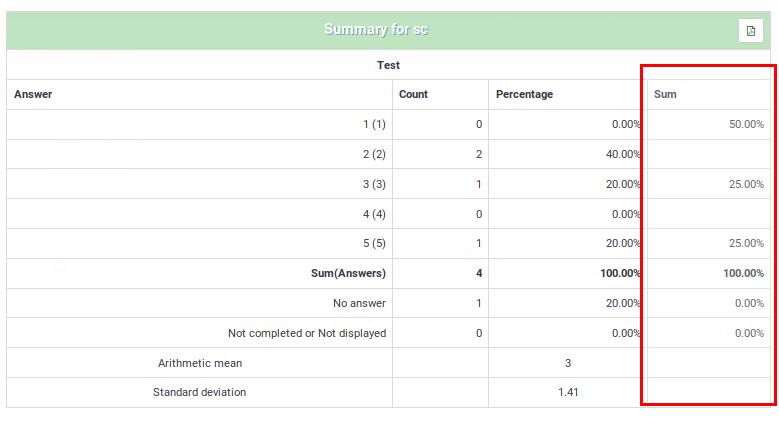
The grouping from the "Sum" column was done in this way because, when rating questions, survey administrators usually interpret the results in this way:
- Y percent of the participants DISLIKE item ABC, where Y represents the percentage of those who answered "1" and "2"
- X percent of the participants LIKE item ABC, where X represents the percentage of those who answered "4" and "5"
- Z percent of the participants have a NEUTRAL opinion about item ABC, where Z represents the percentage of those who answered "3"
| Answer | Count | Sum |
|---|---|---|
| 1 | 0 | 50% (the percentage of those who answered "1" and "2") |
| 2 | 2 | |
| 3 | 1 | 25% (the percentage of those who selected "3" - the neutral option) |
| 4 | 0 | |
| 5 | 1 | 25% (the sum of those who answered "4" and "5") |
| Sum (Answers) | 4 | 100% |
| No answer | 1 | 0% (always "0%") |
| Not completed or displayed | 0 | 0% (always "0%") |