Statistika
From LimeSurvey Manual
Do statistike ankete lahko pridemo preko menija za ogled rezultatov. Le ta je seveda dosegljiva le v primeru, ko je anketa že enkrat aktivirana.
Na naslednji povezavi se nahaja kratek video vodič kako priti do statistike ankete: Video vodič.
Kakšna je funkcija statistike?
Za primer si vzemimo aktivno ali že zaključeno anketo, kjer želite narediti analizo rezultatov. LimeSurvey omogoča prenos vseh odgovorov v Excelovo obliko (ali CSV/PDF/HTML datoteko). Ko so enkrat v tej obliki, jih lahko poljubno oblikujete oziroma obdelujete in na ta način analizirate. Lahko pa tudi uporabite funkcijo statistike in s tem pridobite vpogled v analizo vaših podatkov, kjer lahko pridobite kar nekaj koristnih informacij.
Funkcija statistike vam omogoča 'filtriranje' posameznih pridobljenih podatkov oziroma odzivov iz različnih področjih. Skripta statistike ne poizkuša delati kompleksnih filtriranj - vendar boste kljub temu navdušeni nad vrsto informacij, ki jih je mogoče z lahkoto pridobiti.
Ogled rezultatov in povratnih informacij
S klikom na "Izdelaj statistiko" vam bo predstavljen seznam vseh možnih vprašanj. Posamezno vprašanje vsebuje potrditveno polje, ki ga lahko kliknete, da se prikaže povzetek tega vprašanja in ikona, ki jo lahko kliknete (ali miško le pridržite na njej) in prikazalo se vam bo celotno besedilo vprašanja. Če si želite ogledati rezultate vprašanja oziroma vprašanj, označite potrditvena polja na vrhu vprašanja in "Poglej statistiko". Druga možnost je, da označite potrditveno polje na vrhu posamezne skupine vprašanj in nato kliknite na gumb "Poglej statistiko".
S tem dobite tabelo "Rezultati", ki prikazuje število primerov in tabelo "Povzetek polj" za vsako izbrano vprašanje posebej, ki povzemata vsa možna vprašanja in odgovore, njihove vsote in odstotek.
Filtriranje podatkov
Podatke lahko filtrirate na več načinov:
- Po izboru podatkov - v spustnem seznamu lahko izberete naslednje možnosti: Vse odgovore, samo dokončane ankete, samo nepopolni odgovori
- Po ID odgovora - za filtriranje preko ID številk uporabite vhodne podatke
- Po filtru odgovorov - za filtriranje po podatkih posameznih odgovorov izberite enega ali več odgovorov na seznamu, ki se nahajajo pod posameznim vprašanjem (za izbiro več odgovorov iz istega seznama uporabite CTRL). Upoštevajte, da če se odločite, da si ogledate povzetek vseh razpoložljivih polj (potrditvena polja na vrhu), boste morali izbrati želene filtre preden boste označili ta potrditvena polja.
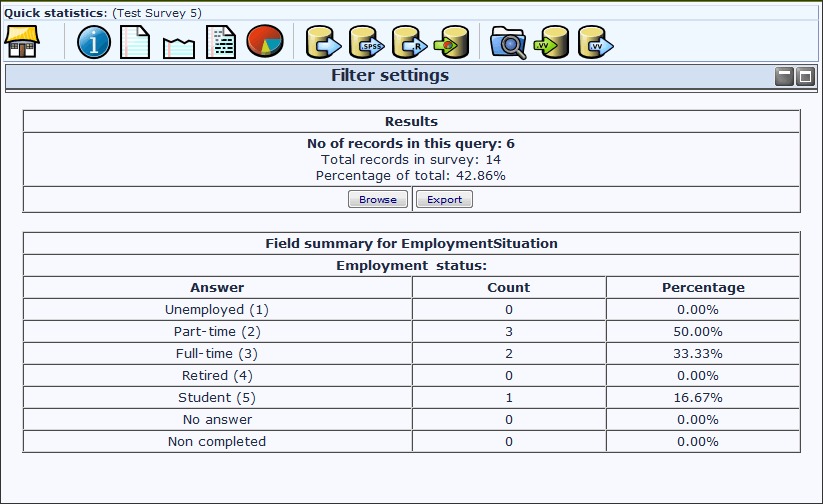
S klikom na "Poglej statistiko" boste imeli možnost vpogleda v tabelo "Rezultati", ki prikazuje število odgovorov na podlagi kriterija, ki ste ga vi predhodno določili. Hkrati se prikaže tabela "Povzetek polja" za posamezno vprašanje, kjer je viden celoten povzetek odgovorov in vprašanj, vsota in njihov odstotek. Pomembno je vedeti, da so ti rezultati podskupina vaših celotnih odgovorov. Za primerjavo: če se na podlagi vašega kriterija prikaže 146 zapisov od 180, bo povzetek prikazal le rezultate teh 146 zapisov.
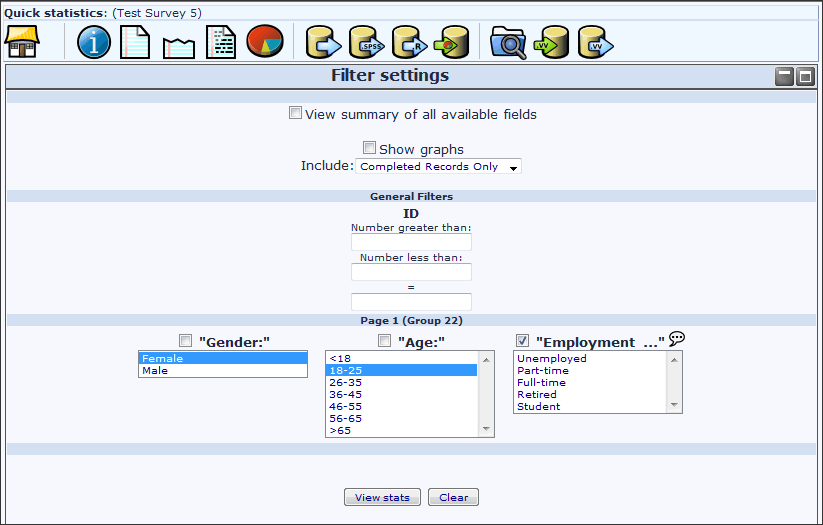
Slika spodaj prikazuje, da želimo vpogled v statistiko za "Status zaposlitve", kjer morajo biti upoštevani naslednji filtri samo dokončane ankete/ženska/starost 18-25. Od 14 zapisov smo pridobili 6 rezultatov.
Pozorni bodite na naslednje stvari:
- Če določite kriterij na isto vprašanje od katerega želite povzetek, potem bodo predstavljeni le tisti odgovori tega vprašanja, ki ustrezajo postavljenim kriterijem. Priporočljivo je, da ne postavljate kriterija na vprašanje od katerega pridobivate povzetek.
- Če želite izbrati več vnosov pri istem vprašanju, pri izbiranju držite CTRL tipko. Če želite preklicati zadnje izbran kriterij, ponovno kliknite na že izbran odgovor in pri tem še vedno držimo CTRL tipko.
Pregled / Izvoz rezultatov filtra
If you want to export the responses that match your criteria, click on the "export" button at the bottom of the 'Results' table. This will bring up the usual export screen, however when you export the results you will only receive the responses that match your criteria. Similarly, click on browse to view the matching responses in the browse screen.
Graphs
For charting the library pChart is used which is completely included and usually doesn't have to be configured.
However for some languages (like Chinese) the usual font used (Vera) does not cover the needed character set. In that case you can use the setting $chartfontfile to set a new TTF font file in config.php (Check out config-defaults.php for the right setting). For Chinese (Simplified and Traditional) we recommend to use the FireFlySung font which can be downloaded from [1].
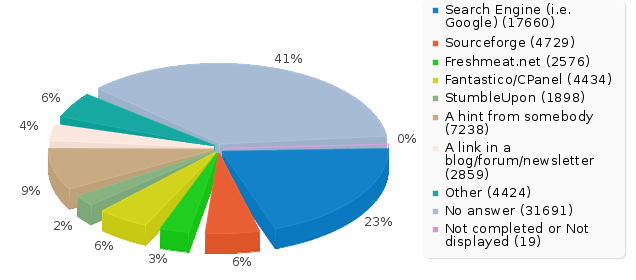
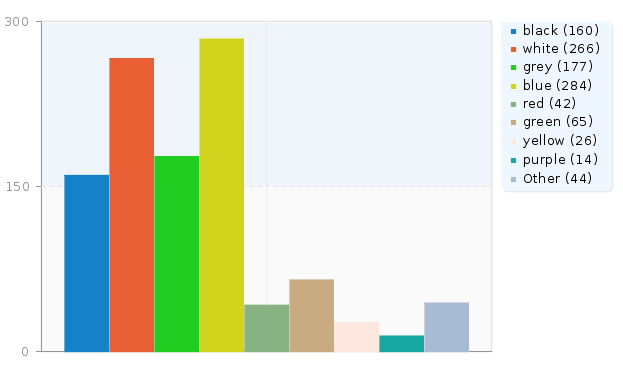
After the graphs have been generated you can export these graphs easily. Use a right-mouse-click over the image and choose "Save image as" and save the graph as a .png-file to your chosen location. Normally all results are displayed as pie charts - only for question type "Multiple Options" bar graphs are used.


"incomplete responses", "no answers" and not "completed/not displayed" counts
"incomplete responses" counts: all responses that started, but weren't completed. A response started when the participant clicked "Next" button in the survey, but click the "Submit" button in the end.
Technically speaking, this is when there is no SubmitDate in the response table for this entry, but new data set was created already.
A question with "no answer" counts: when the question was displayed, but the participant hasn't given an answer.
Technically speaking, this is when the question is not mandatory, was displayed, received no answer and the user clicked Next or Submit: the consequence is that the database field for this answer is set to "" (empty string). This "no answer" status cannot be really computed for Date or pure Numerical questions where the database field cannot record a string.
A question with "not completed/not displayed" counts: when the page containing the question was not displayed. This can be because of conditions, or just because the participant left the survey before this page was displayed (or just while this page is displayed, but without clicking the Next button).
Technically speaking, the database field for this question is filled with a NULL value.
Public Statistics
LimeSurvey includes functionality to display simple statistics to your participants after they have completed filling out an online survey.
There are two steps involved in activating and displaying statistics to your participants. Firstly you must enable public statistics for your survey (by default this is turned off). This setting is in your main survey toolbar, General Settings – in the Presentation and Navigation Tab. Look for the setting "Public Statistics". There is also a setting here called "Show graphs in public statistics" which – if turned on – will show graphs as well as the counts (by default only numerical statistics are displayed).
Once you’ve set your survey to display statistics, you need to indicate question-by-question which statistics are displayed to your participants. By default, no questions are selected for display.
You choose which questions will be shown in the public statistics page by editing each question. In the Advanced Settings for each question is an option "Show in public statistics". Once you set this advanced setting to "Yes" the question will be included on the public statistics page.
* Additional question attribute "public_statistics"
What participants see
Once you’ve enabled public statistics, and selected some questions to display, an additional option will be visible to participants when they’ve completed filling out your survey. In addition to the usual thank you, there will be a link to "View the statistics for this survey"
If your participants click on this link they will be able to see a page detailing the responses to the questions you’ve selected, and a graph (if you chose to display graphs too).
Changing the look of the public statistics page
The public statistics page has a template of it’s own that can be edited in the limesurvey template editor.

