Statistics/ja: Difference between revisions
From LimeSurvey Manual
(Updating to match new version of source page) |
Bravehorse (talk | contribs) (Replaced content with "=概要=") |
||
| Line 1: | Line 1: | ||
<languages /> __TOC__ | <languages /> __TOC__ | ||
= | =概要= | ||
The statistics feature is available from the survey toolbar by clicking first on the [[File:browse.png]] 'Response and Statistics' menu entry in then last drop-down menu (which is only available if a survey has been activated) and then click the [[File:statistics.png]] statistics button. | The statistics feature is available from the survey toolbar by clicking first on the [[File:browse.png]] 'Response and Statistics' menu entry in then last drop-down menu (which is only available if a survey has been activated) and then click the [[File:statistics.png]] statistics button. | ||
Revision as of 16:23, 4 June 2018
概要
The statistics feature is available from the survey toolbar by clicking first on the File:Browse.png 'Response and Statistics' menu entry in then last drop-down menu (which is only available if a survey has been activated) and then click the  statistics button.
統計機能とは
アンケートを実行し、終了して、結果についての分析に着手するところであるとします。LimeSurveyはすべての結果をExcelのシート(もしくはCSVファイルやWordのファイル)に出力するので、あとは分析者のお好みのままに、あれこれ加工できます。
以上のかわりに、統計機能を用いると、回答結果をざっと眺めて基本的な情報を得ることからスタートできます。統計機能を用いれば、データを「フィルタ」して不要なフィールドを除くことができます。この機能は複雑なフィルタリングを提供しようというものではありませんが、基本的な統計情報を驚くほど簡単に得ることができます。
統計を表示する
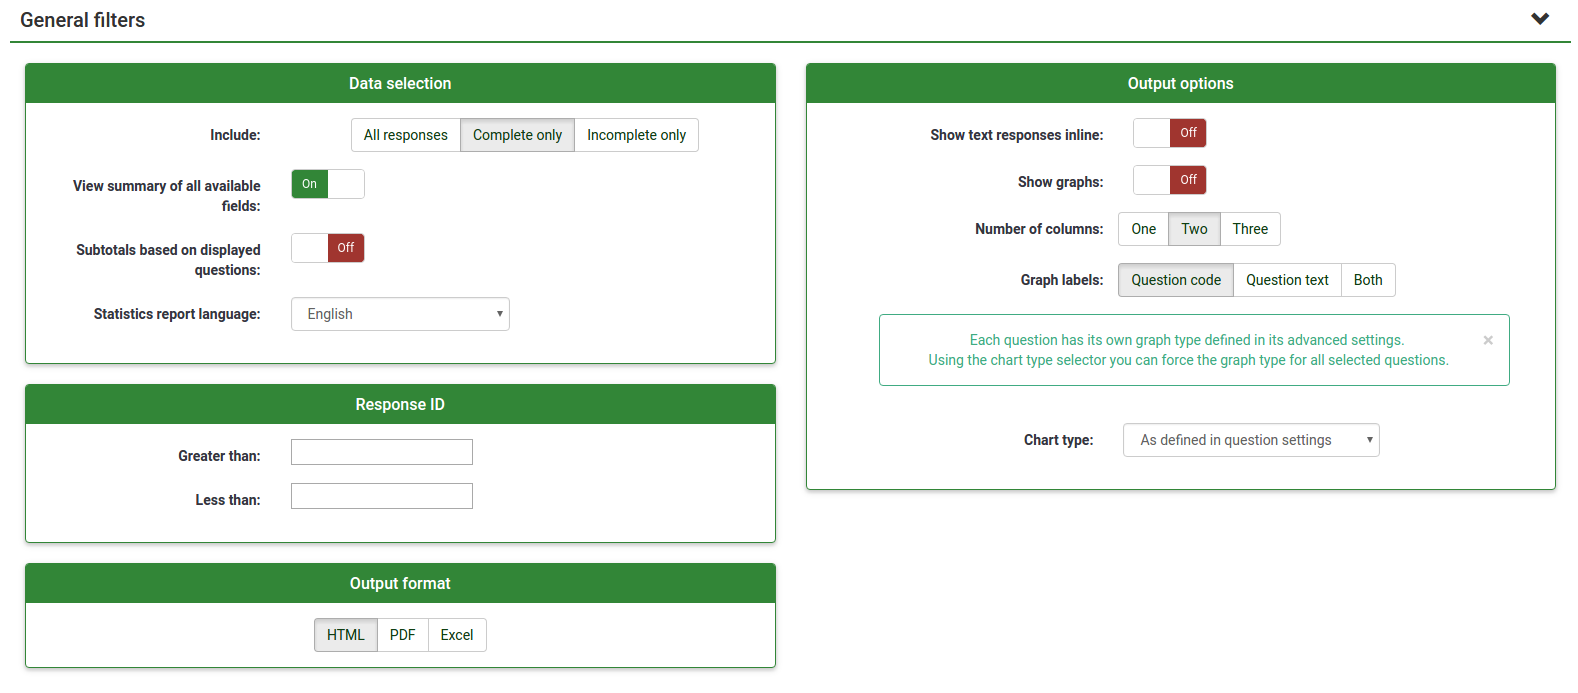
統計機能のボタン を押すと、フィルタの設定画面が表示されます。
- IDの最小値・最大値を入力すると、IDがそれよりも大きな・小さな回答者の回答だけが集計されます。
- チェックボックスに印を付けた質問についてだけ、統計情報が表示されます。複数のボックスに印を付けることも可能です。すべての質問について統計情報を表示したいときには「照会可能な全フィールドの概要を見る」のラジオボタンをONにしてください。スピーカーのアイコンをクリックすると(またはマウスカーソルを乗せると)、質問の全文が表示されます。
- 「不完全な回答をフィルタ」を許可すると、未完了の回答はすべて統計から除外されます。回答の完了/未完了の区別についての詳細は、アンケートの結果を閲覧の項をご覧ください。
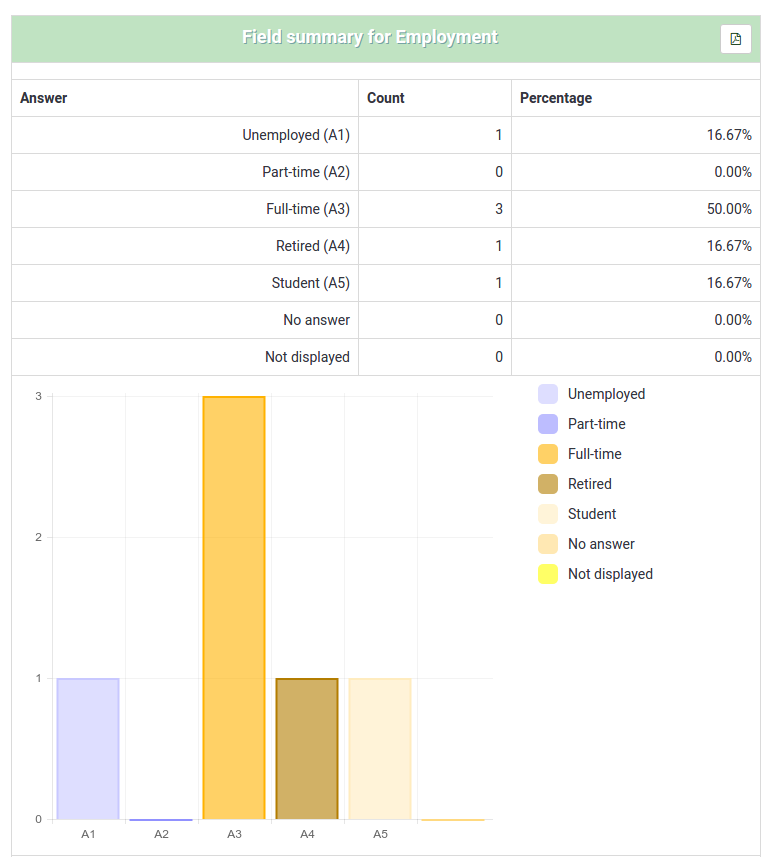
「統計を表示」をクリックすると、指定したフィルタのもとで、チェックを入れた質問の回答についての統計情報が表示されます。全体についてはクエリに含まれるレコード数、全レコード数、百分率が、各質問については、選択肢ごとの回答者数、および、その百分率が表示されます。
回答をフィルタして統計を取る
Data can be filtered in several ways:
- By survey completion - select Completed, Incomplete or All records. For a discussion on incomplete responses see Browsing survey results.
- By ID - use the inputs to filter by ID number
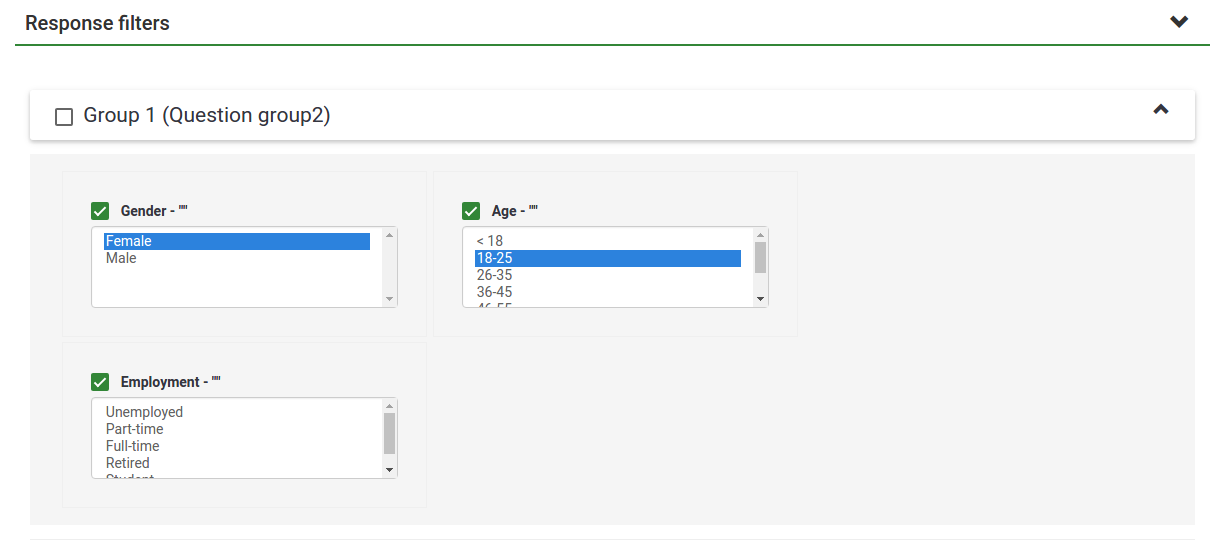
- By response - click on one or more responses in the list under each question to filter the data by those responses (use CTRL/click to select multiple responses in the same question). Note that if you choose to view summary of all available fields (checkbox at top) you will need to select your response filters before checking that box.
- By text - You can search the responses to a free text question type (and similar types) by entering a text. If you want to search for a partial string you can use the percentage sign (%) as wildcard. Example: If you look for 'Tom%' it will find entries with 'Tomb' and 'Tommy', etc.
もし情報を集計したい質問自体に表示基準が設定されていると、基準に適合した回答だけが集計されます。ただしこのようにして作成した統計は混乱を招くことがあるので、集計する質問自身には基準を設定しないほうがお勧めです。
The images below indicate that I have elected to view the stats for "Employment status" of completed records/female/age 18-25. This gives me the results for 6 out of 13 records.
Things to be cautious of
- If you set criteria on the same question that you ask for a summary, then that question will only present answers matching your criteria. So it is good practice not to set any criteria on the same question you are getting a summary of.
- To select multiple entries for a question hold down the CTRL button when clicking. To 'unselect' the last criteria (if you want to clear all criteria from a question) click on the last highlighted answer with the CTRL button.
フィルタした結果を閲覧・出力する
条件に適合した回答だけを出力する場合は、結果テーブルの下にある「出力」ボタンを押します。通常の出力画面が表示され、条件に適合した結果だけが保存されます。また「閲覧」ボタンを押せば、条件に適合した結果だけを見ることができます。
JPGraph
config.phpにJPGraph-libraryを設定してあれば、アンケートの結果を下のようなグラフで表現することができます。グラフの出力も簡単にできます。グラフの上でマウスを右クリックして「画像として保存」を選択すれば、png形式で保存できます。ほとんどの質問形式については円グラフが用いられますが、複数選択形式の質問についてだけは棒グラフが用いられます。
しかし、いくつかの言語(例:中国語)で通常使われているフォント(Vera)には必要な文字セットが含まれていません。そのような場合は config.phpの$chartfontfile に新しくTTFフォントを設定して下さい。(config-defaults.phpを確認して正しく設定して下さい) 中国語(簡体字・繁体字)の場合はFireFlySungフォントを推奨しています。以下からダウンロードできます[1]。
一旦グラフが作成されれば、更に簡単にグラフをエクスポートすることができます。画像の上で右クリックし、"名前を付けて画像を保存"を選択してグラフをpngファイルとして適当な場所に保存して下さい。ほとんどの集計に円グラフが表示されますが、"複数回答"の質問は棒グラフが表示されます。


"未完了回答"、"わからない"と"未完了あるいは非表示"の件数
"未完了回答"件数:回答を開始したが、完了していないものの件数です。回答は参加者が調査の"次へ"ボタンをクリックすることで開始されていますが、最後の"投稿する"ボタンが押されていない状態です。
技術的には、入力に対するレコードが回答テーブルに作成されているが、投稿日はセットされていないという場合です。
"わからない"件数:質問は表示されたが参加者が回答しなかった場合です。
技術的には、必須ではない質問が表示され回答がないまま"次へ"や"投稿する"がクリックされた場合で、データベースには""(空文字列)がセットされます。この"わからない"はデータベース上で文字列で記録されない日付型や数値型には発生しません。
"未完了あるいは非表示"件数:表示されなかった質問がある場合です。これは質問の条件設定や、参加者がページが表示される前に"次へ"ボタンを押した場合に発生します。
技術的には、この質問に対してデータベースにはNULLが記録されます。
統計の公開
LimeSurveyには簡単な統計を参加者に公開する機能があります。参加者はオンラインで調査をすべて入力した後にそれを見ることができます。
There are two steps involved in activating and displaying statistics to your participants. Firstly you must enable public statistics for your survey (by default this is turned off). This setting is in your main survey toolbar, General Settings – in the Presentation and Navigation Tab. Look for the setting "Public Statistics". There is also a setting here called "Show graphs in public statistics" which – if turned on – will show graphs as well as the counts (by default only numerical statistics are displayed).
Once you’ve set your survey to display statistics, you need to indicate question-by-question which statistics are displayed to your participants. By default, no questions are selected for display.
You choose which questions will be shown in the public statistics page by editing each question. In the Statistics Tab for each question is an option "Show in public statistics". Once you set this setting to "On" the question will be included on the public statistics page.
What participants see
Once you’ve enabled public statistics, and selected some questions to display, an additional option will be visible to participants when they’ve completed filling out your survey. In addition to the usual thank you, there will be a link to "View the statistics for this survey"
If your participants click on this link they will be able to see a page detailing the responses to the questions you’ve selected, and a graph (if you chose to display graphs too).
Changing the look of the public statistics page
The looks of the public statistics page can be modified via template.css (search for "#statsContainer"). However, there is currently no template of it’s own that can be edited in the limesurvey template editor.


