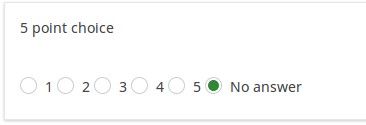
Tipo de pregunta - Elegir del 1 al 5
From LimeSurvey Manual
Descripción general
Esta pregunta muestra una escala horizontal de 1 a 5 desde donde los participantes de la encuesta pueden seleccionar una única opción de respuesta.

Ejemplo: Ejemplo de pregunta de opción única.zip
Opciones generales
Pantalla
Use slider layout (slider_rating)
Description
This activates an alternative representation of a question using stars or a slider with an emoticon (smiley face). Available in v1.91 or later.
Available option
- No (default)
- Yes - stars
- Yes - slider with emoticon
Relevance help for printable survey (printable_survey_relevance_help)
Description
If you wish to print a survey, you can also print the relevance equations for each question. But, if you wish to offer instead an explanation rather than the expression on the printed form, fill in this box with the text explanation for the relevance equation.
Valid values
- Any text and/or numbers you wish to be displayed on the printable form.
Lógica
Otro
Statistics
Show in public statistics (public_statistics)
Description
This attribute allows the survey administrator to chose if a particular question results should be displayed to the survey participants after they submitted the survey.
The default setting for each question is 'Off' (=Do not show the question statistics to the respondents). You have to enable this for every single question if you want to show the survey statistics of that (those) particular question(s) to the survey participants after the survey submission.
Available options
- On
- Off (default)
Display chart (display_chart)
Description
This attribute allows the survey administrator to choose if a chart that contains the question results should be displayed to the survey participants after they filled out the survey.
- public statistics survey setting from the presentation & navigation settings
- show graphs survey setting from the presentation & navigation settings
- public statistics question attribute, and
- display chart question attribute.
Available options
- On
- Off (default)
Chart type (chart_type)
Description
This attribute allows the survey administrator to choose which type of chart will be displayed to the respondent once he/she finished filling out the survey.
Available options
- Bar chart
- Pie chart
- Radar
- Line
- PolarArea
- Doughnut