Statistics/it: Difference between revisions
From LimeSurvey Manual
Maren.fritz (talk | contribs) (Created page with "<center>File:Formato di output - statistiche.png</center>") |
Maren.fritz (talk | contribs) (Created page with "* '''HTML''' (opzione predefinita): le statistiche vengono visualizzate in LimeSurvey. * '''PDF''': verrà visualizzato un popup che chiede di salvare le statistiche come file...") |
||
| Line 186: | Line 186: | ||
* '''HTML''' ( | * '''HTML''' (opzione predefinita): le statistiche vengono visualizzate in LimeSurvey. | ||
* '''PDF''': | * '''PDF''': verrà visualizzato un popup che chiede di salvare le statistiche come file PDF.!N !* '''Excel''': Per lavorare ulteriormente con i tuoi dati (filtrati), scegli Excel. Puoi esportare il file da un'applicazione per fogli di calcolo in CSV per lavorare con strumenti statistici più avanzati come SPSS o R. | ||
* '''Excel''': | |||
Revision as of 07:23, 31 July 2023
Generale
Lo scopo di un sondaggio è "ottenere risposte alle domande". Dopo aver creato, attivato e invitato i partecipanti a completare il sondaggio, puoi utilizzare la funzionalità Risposte e statistiche per raccogliere e analizzare i risultati del sondaggio per ottenere risposte.
La funzionalità delle statistiche si trova sotto il menu delle risposte di un sondaggio attivo: Risposte > Risposte e statistiche Risposte è disponibile solo se è stato attivato un sondaggio.

Fai clic su Statistiche nella barra degli strumenti in alto.
Verrà visualizzata la pagina seguente.
Le statistiche di LimeSurvey possono essere visualizzate in modalità esperto o in modalità semplice. Per impostazione predefinita, la modalità esperto viene visualizzata quando fai clic su Statistiche
Statistiche - modalità esperto
Il tuo sondaggio è terminato e ora vuoi iniziare ad analizzare i risultati. LimeSurvey può esportare tutti i risultati in un foglio di calcolo Excel o in un file CSV.
La funzione Statistiche - modalità esperto ti consente di "filtrare" i tuoi dati e recuperare numeri e riepiloghi di diversi campi. Lo script delle statistiche non esegue filtri molto complessi, ma ci sono molte informazioni molto utili che possono essere facilmente ottenute.
Esecuzione di statistiche rapide
Nello screenshot qui sotto, puoi vedere che c'è una casella di controllo per ogni domanda che può essere selezionata in modo da mostrare un riepilogo delle risposte per ogni domanda e un'icona che, se cliccata (o se il mouse ci passa sopra), ti dà il testo completo della domanda. Per visualizzare i risultati di una o più domande, seleziona le caselle di controllo nella parte superiore della domanda e poi fai clic su "Visualizza statistiche".
In alternativa, per visualizzare i risultati di tutte le domande disponibili, abilitare "Visualizza riepilogo di tutti i campi disponibili" e quindi fare clic su "Visualizza statistiche".
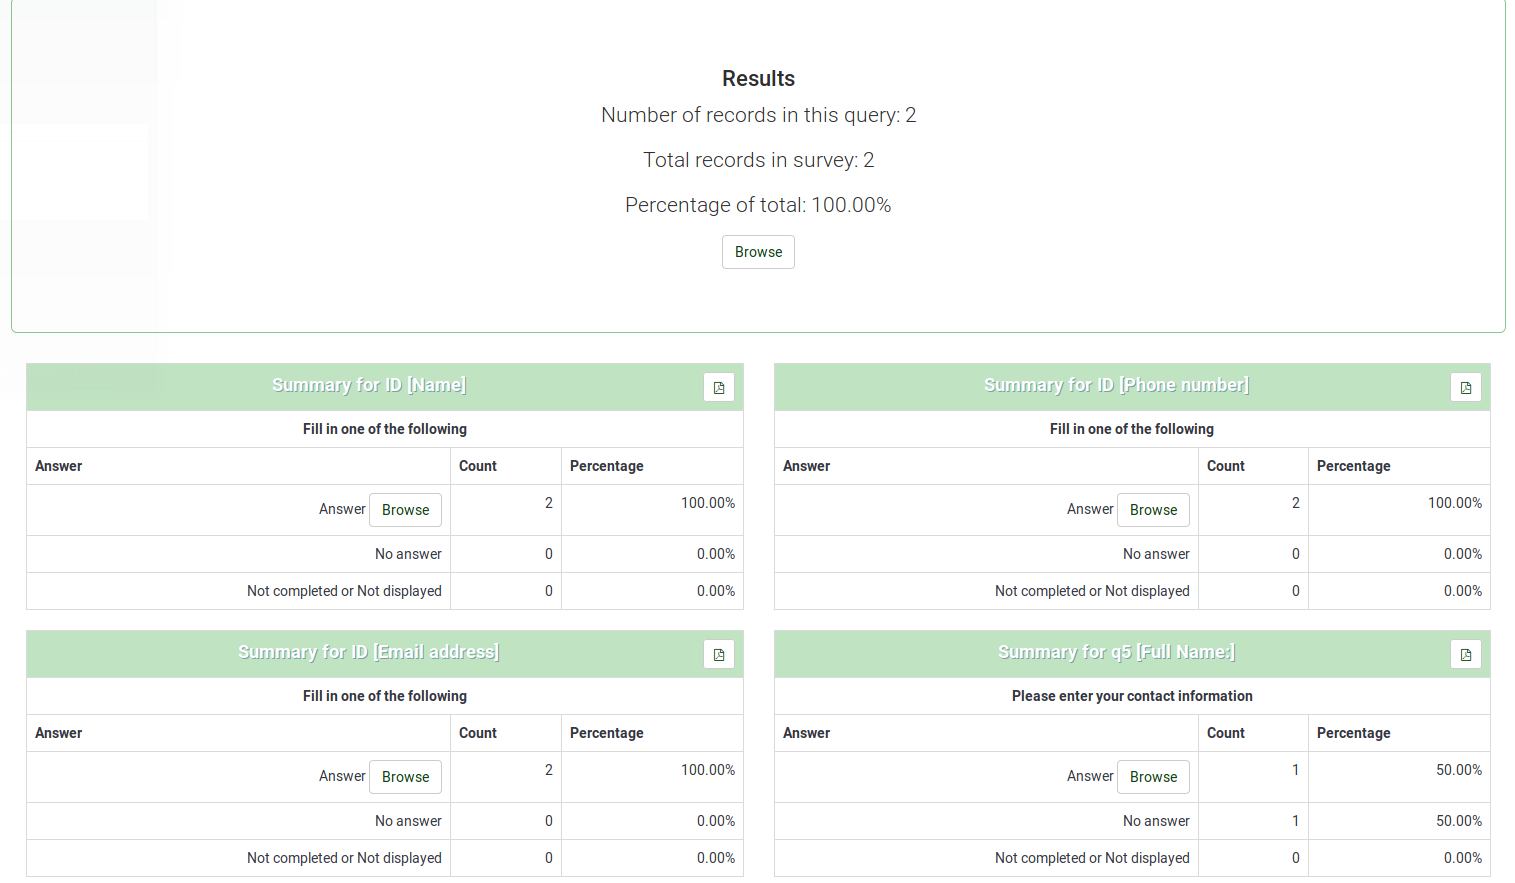
Ti verrà quindi fornita una tabella "Risultati" che indicherà il numero di casi e una tabella "Riepilogo campi" per ogni domanda selezionata che riassume tutte le possibili risposte nelle domande, i loro totali e le loro corrispondenti percentuale.
Filtraggio dei dati
Esistono due tipi di filtri: generali e filtri di risposta.
Filtri generali
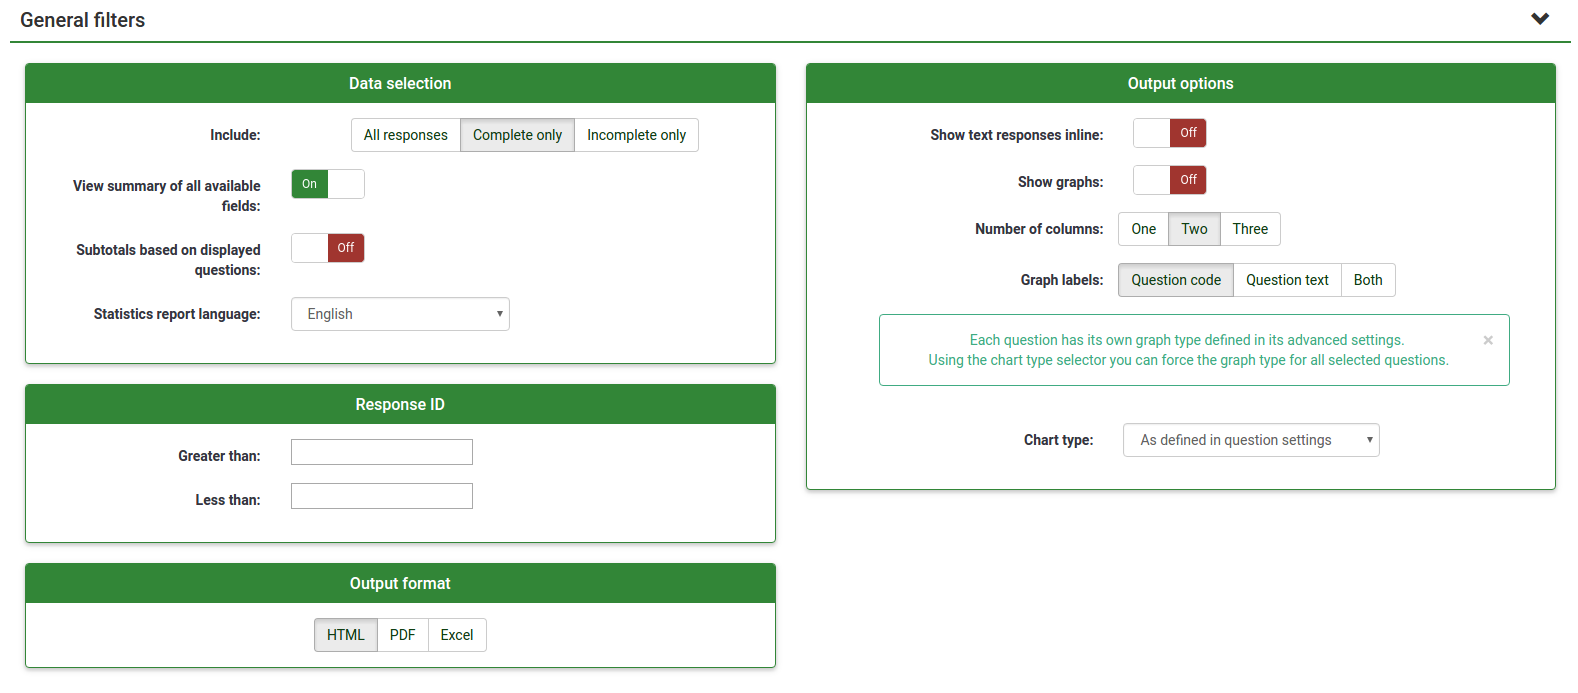
Come suggerisce il nome, Filtri generali si riferisce ai filtri a livello generale (macro).
I filtri possono essere correlati a:
- Selezione dati
- Tipo di risposte:
- Risposte complete: risposte che contengono una data di invio
- Risposte incomplete: risposte che non non contengono una data di invio
- Tutti i record: il numero aggregato di risposte complete e incomplete.
- Lingua report statistico: se vengono utilizzate lingue aggiuntive, questa opzione di filtro è utile per dividere i partecipanti in base alla lingua utilizzata per compilare il sondaggio..
- Tipo di risposte:
- Visualizza riepilogo di tutti i campi disponibili: Disattivato per impostazione predefinita. Abilitandola, tutte le domande ei gruppi del sondaggio verranno presi in considerazione durante l'esecuzione dello script delle statistiche
- Totali parziali basati sulle domande visualizzate: Disattivato per impostazione predefinita. Conta le statistiche per ogni domanda in base solo al numero totale di risposte per le quali è stata visualizzata la domanda (buon modo per filtrare le risposte non finite/incomplete).
- ID risposta: Utilizza il numero ID per filtrare le risposte raccolte
- Data di invio:Visualizzata solo se timing è abilitato. Puoi filtrare i dati in base alla data di invio delle risposte raccolte.
Per ottenere le risposte filtrate solo in base ai filtri generali, abilitare l'opzione "Visualizza riepilogo di tutti i campi disponibili" e fare clic sul pulsante Visualizza statistiche situato nella parte in alto a destra della schermo.
Filtri di risposta
A seconda del tipo di domanda utilizzato, è possibile utilizzare diversi campi per filtrare le risposte:
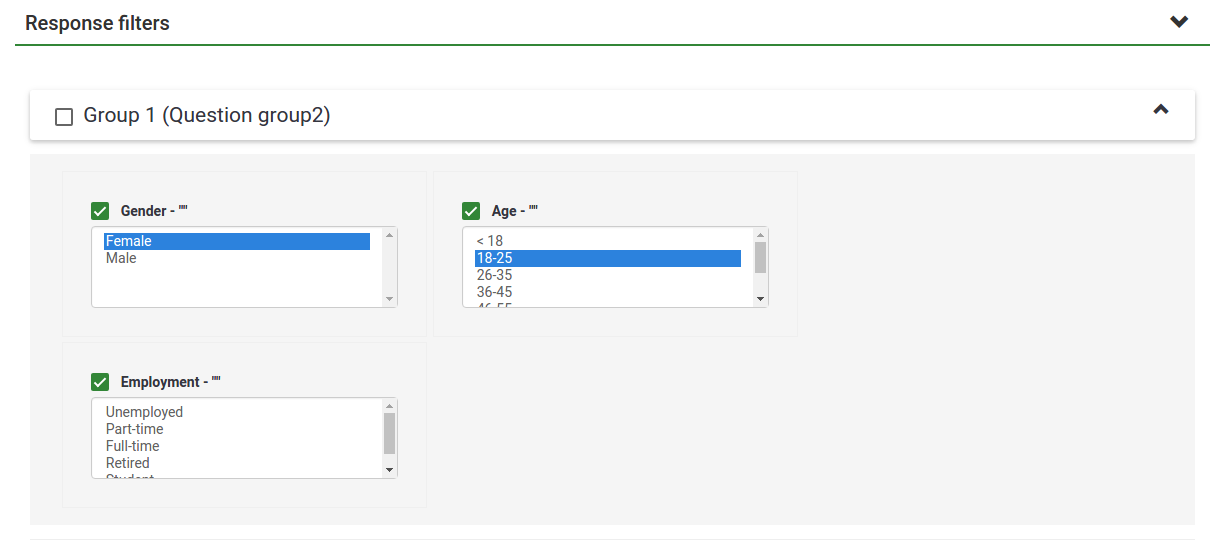
- Per risposta: fai clic su una o più risposte nell'elenco sotto ogni domanda per filtrare i dati in base a tali risposte (usa CTRL/clic per selezionare più risposte nella stessa domanda). Tieni presente che se scegli di visualizzare il riepilogo di tutti i campi disponibili (casella di controllo in alto), dovrai selezionare i filtri di risposta prima di selezionare tale casella.
- Per testo:Puoi cercare le risposte a un tipo di domanda a testo libero (e tipi simili) inserendo un testo. Se vuoi cercare una stringa parziale puoi usare il segno di percentuale (%) come carattere jolly. Ad esempio: se cerchi 'Tom%', troverà le voci con 'Tomb' e 'Tommy', ecc.
- Per valore numerico: Puoi cercare le risposte che contengono un certo valore numerico se vengono utilizzati i tipi di domanda basati sui numeri.
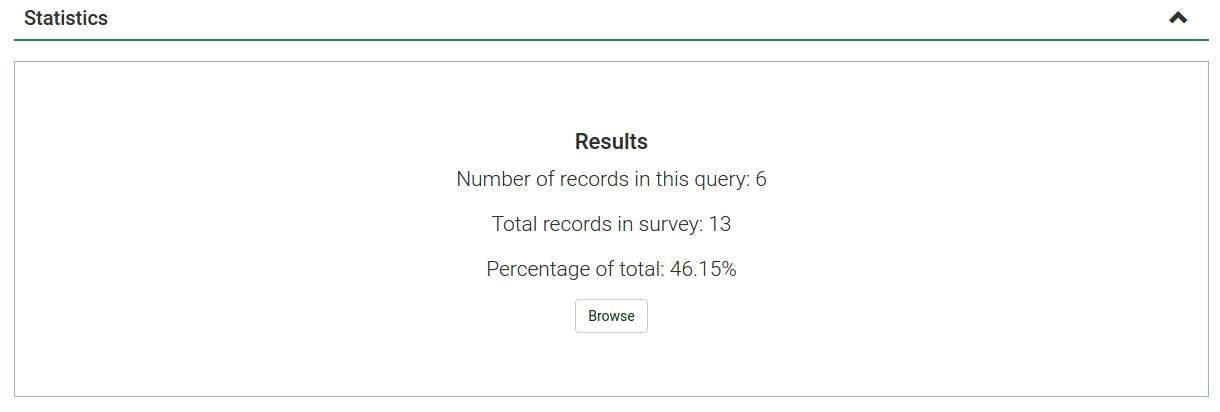
Selezionando Visualizza statistiche ti verrà mostrata la tabella Risultati, che indica il numero di risposte corrispondenti ai tuoi criteri, e una tabella Riepilogo campi per ogni domanda selezionata che riassume tutte le possibili risposte nella domanda/e, i loro totali e la loro percentuale. È importante notare che questi risultati sono un sottoinsieme delle risposte totali. Quindi, ad esempio, se i tuoi criteri visualizzano 146 record su un totale di 180, il riepilogo mostrerà la suddivisione solo di quei 146 record per quella tabella.
Le immagini sottostanti indicano che l'utente ha scelto di visualizzare le statistiche per "Stato occupazionale" di record completati/femmina/età 18-25. Ciò fornisce i risultati per 6 record su 13.
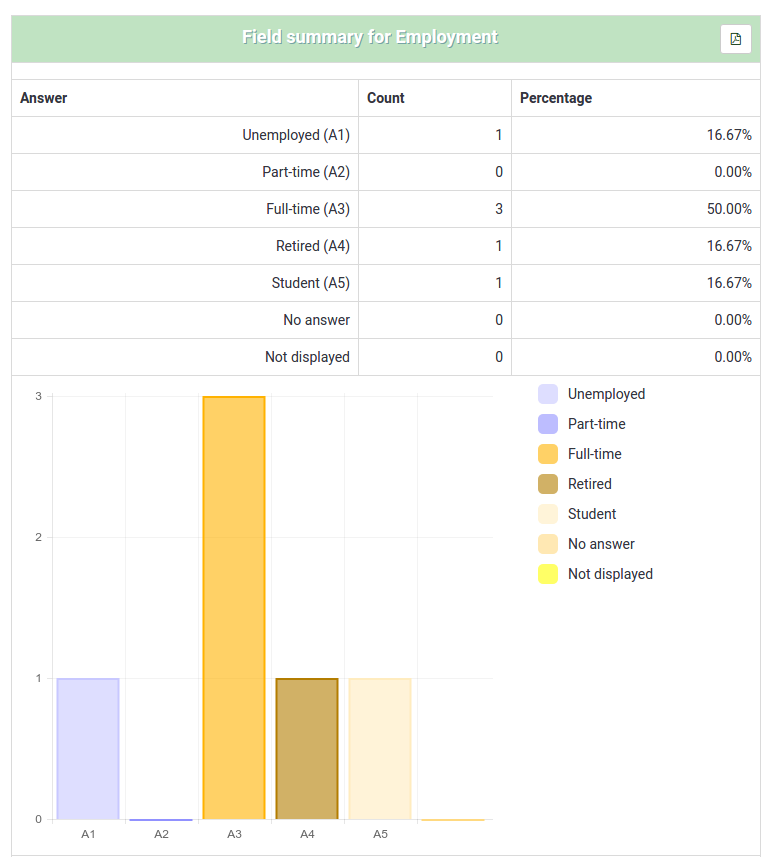
- Se imposti dei criteri sulla stessa domanda per la quale richiedi un riepilogo, quella domanda presenterà solo le risposte corrispondenti ai tuoi criteri. Quindi è buona pratica non impostare alcun criterio sulla stessa domanda di cui stai ricevendo un riepilogo.
- Per selezionare più voci per una domanda, tieni premuto il pulsante CTRL mentre fai clic. Per "deselezionare" gli ultimi criteri (se si desidera eliminare tutti i criteri da una domanda) fare clic sulla rispettiva risposta evidenziata tenendo premuto il pulsante CTRL.
Grafici
Per la creazione di grafici viene utilizzata la libreria pChart, che è completamente inclusa e di solito non deve essere configurata.
Dopo che i grafici sono stati generati, puoi esportarli facilmente. Fai clic con il pulsante destro del mouse sul grafico e scegli "Salva immagine con nome", quindi salva il grafico come file .png nella posizione scelta.
Puoi anche utilizzare la funzione "Esporta immagini" per salvare tutti i grafici.
"Risposte incomplete", "nessuna risposta" e "non completato/non visualizzato" contano
- risposte incomplete: tutte le domande sono iniziate ma non completate: il partecipante ha fatto clic sul pulsante "Avanti" nel sondaggio, ma non ha fatto clic sul pulsante "Invia" (non è arrivato alla pagina finale del sondaggio) .
Non c'è SubmitDate nella response table per questa voce, ma il nuovo set di dati è già stato creato.
- nessuna risposta: la domanda è stata visualizzata, ma il partecipante non ha risposto.
La domanda non è obbligatoria, è stata visualizzata, non ha ricevuto risposta e l'utente ha fatto clic su "Avanti" o "Invia". La conseguenza è che il campo del database per questa risposta è impostato su "" (stringa vuota). Questo stato di "nessuna risposta" non può essere effettivamente calcolato per "Data" o "Domande numeriche" pure in cui il campo del database non può registrare una stringa.
- non completato/non visualizzato: La pagina contenente la domanda non è stata visualizzata. Ciò può essere dovuto a condizioni o perché il partecipante ha abbandonato il sondaggio prima che questa pagina fosse visualizzata (o mentre questa pagina è visualizzata, ma senza fare clic sul pulsante Avanti).
Il campo del database per questa domanda è riempito con un valore NULL.
Formato di output e opzioni
Le statistiche possono essere visualizzate in tre diversi formati:
- HTML (opzione predefinita): le statistiche vengono visualizzate in LimeSurvey.
- PDF: verrà visualizzato un popup che chiede di salvare le statistiche come file PDF.!N !* Excel: Per lavorare ulteriormente con i tuoi dati (filtrati), scegli Excel. Puoi esportare il file da un'applicazione per fogli di calcolo in CSV per lavorare con strumenti statistici più avanzati come SPSS o R.
The output options can be used to alter the way the statistics are displayed. The following options are available:
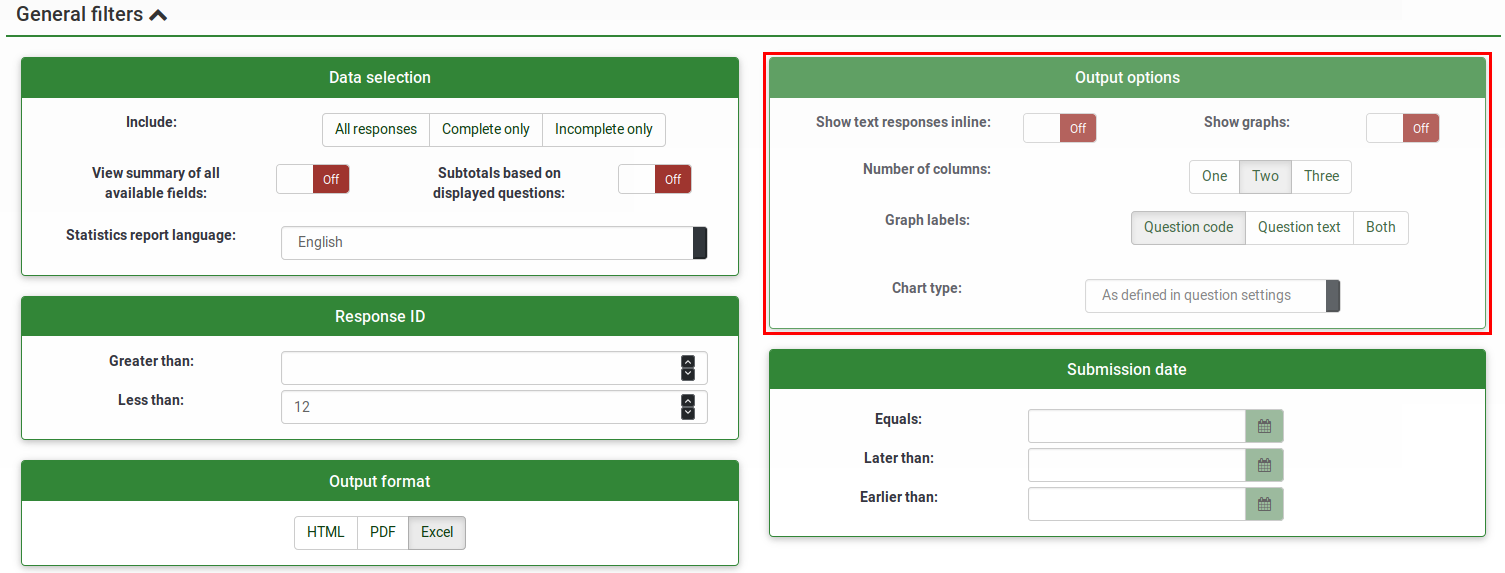
- Show text responses inline: Disabled by default. Shows the text questions responses without having to click a browse button (if enabled; useful for the HTML version of output format)
- Show graphs: Disabled by default. If enabled, graphs will be displayed.
- Number of columns: Two is the default number. If you wish to have statistics and graphs displayed on only one or three columns, choose the desired value from this option. It applies to HTML statistics.
- Graph labels: Choose how the label should look in the graph.
- Question code
- Question text
- Both
- Chart type: the following chart type settings are available:
- As defined in question settings: Useful if you do not want the graph to be displayed. If this is the case, deactivate it from the question settings and select from the "Statistics" panel this option.
- Bar chart
- Pie chart
- Radar chart
- Line chart
- Polar chart
- Doughnut chart
Embed custom logo at statistic PDF
If you want to embed your own logo to the statistics PDF, make sure a file specifically named "statistics.jpg" is placed within the "images" folder of the admin theme used for your system. The admin theme that you would like to use can be set in Global Settings.
Statistics - simple mode
The simple mode was created to provide simple bar chart statistics that can be quickly exported and saved, and then included into a presentation:
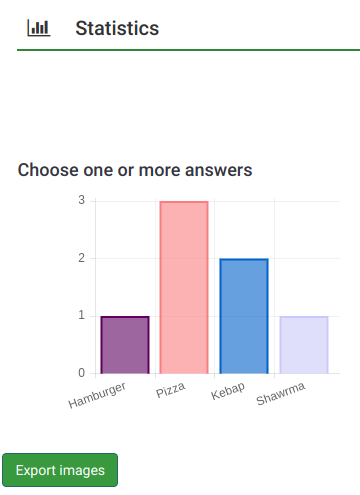
Fewer graphs are displayed than in the expert mode. While in the export mode you can display graphs with respect to those who filled out the survey, did not answer it or did not complete it. the simple mode displays only statistics that rely on the "countable" data submitted by the participants (e.g., single or multiple choice questions as well as array questions).
There is only one option to filter the data within the simple mode - via the responses to be included in the statistics. As a result, the statistics may include the complete responses, incomplete responses, or all responses (the aggregated sum of the first two options). This option is located in the upper-right part of the panel.
To switch back to expert mode, click the "Expert mode" button located in the upper-right part of the screen:

Public statistics
LimeSurvey includes the functionality to display simple statistics to the general public or to your participants after they have completed an online survey.
Two components need to be enabled to activate and display statistics to your participants. The first one refers to the public statistics of your survey which must be enabled (it is turned off by default). It is located under the Presentation tab. To also show graphs, look on the same page for the Show graphs in public statistics attribute and enable it (it is disabled by default).
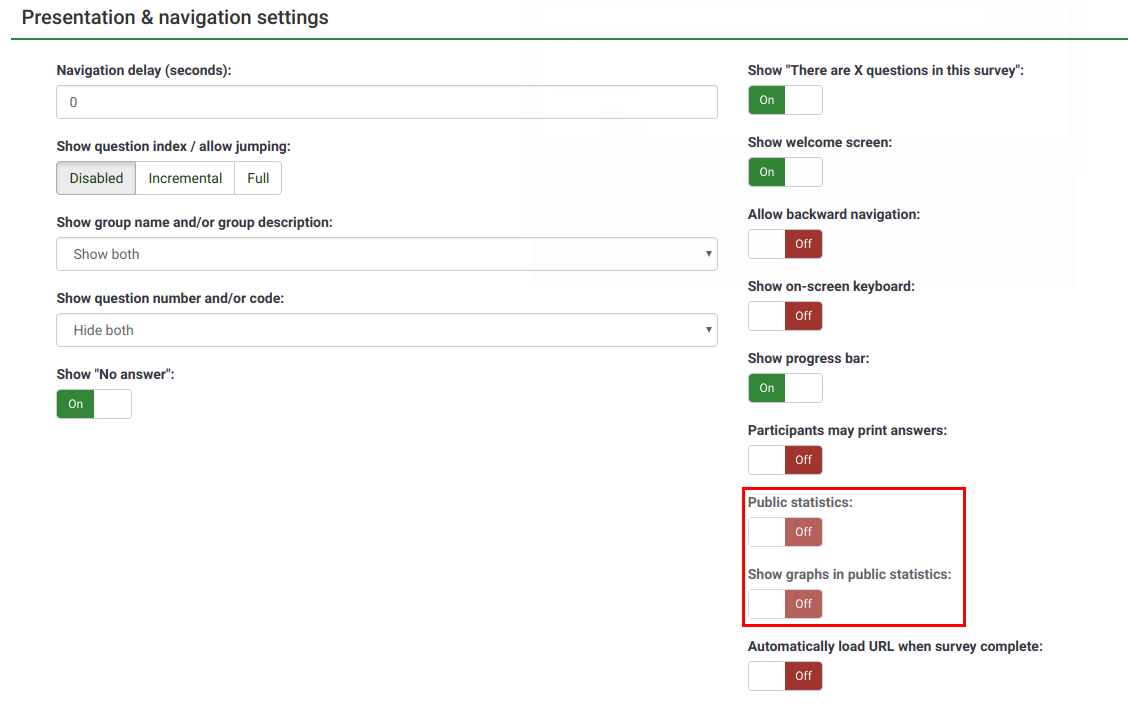
Once you have set your survey to display statistics, you need to indicate question-by-question which statistics you want to be displayed to your respondents. By default, no questions will be displayed. To have them displayed, access the desired question, look for the "Statistics" tab and enable the Show in public statistics attribute.
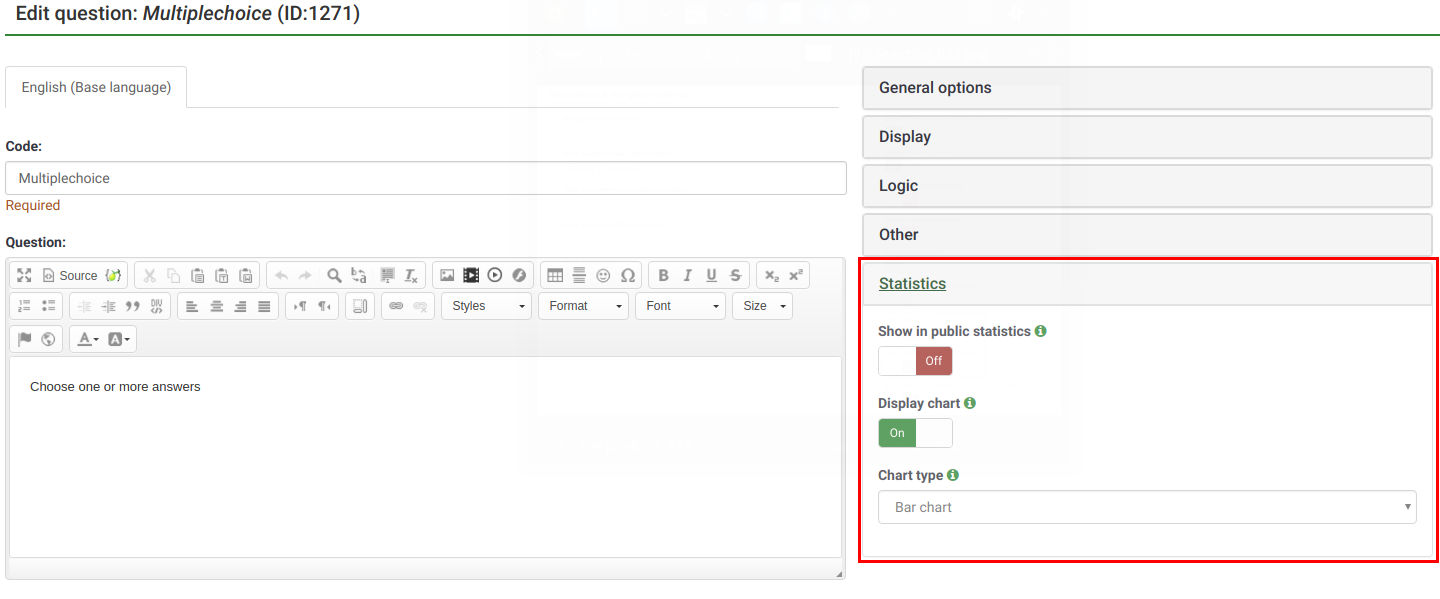
What participants see
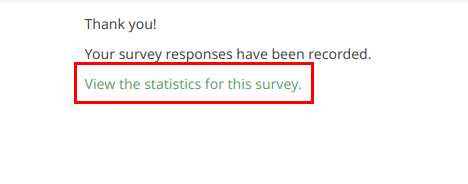
Once you have enabled public statistics and selected some questions to display, an additional option will be visible to participants when they complete your survey. In addition to the usual thank you, there will be a link to "View the statistics for this survey":
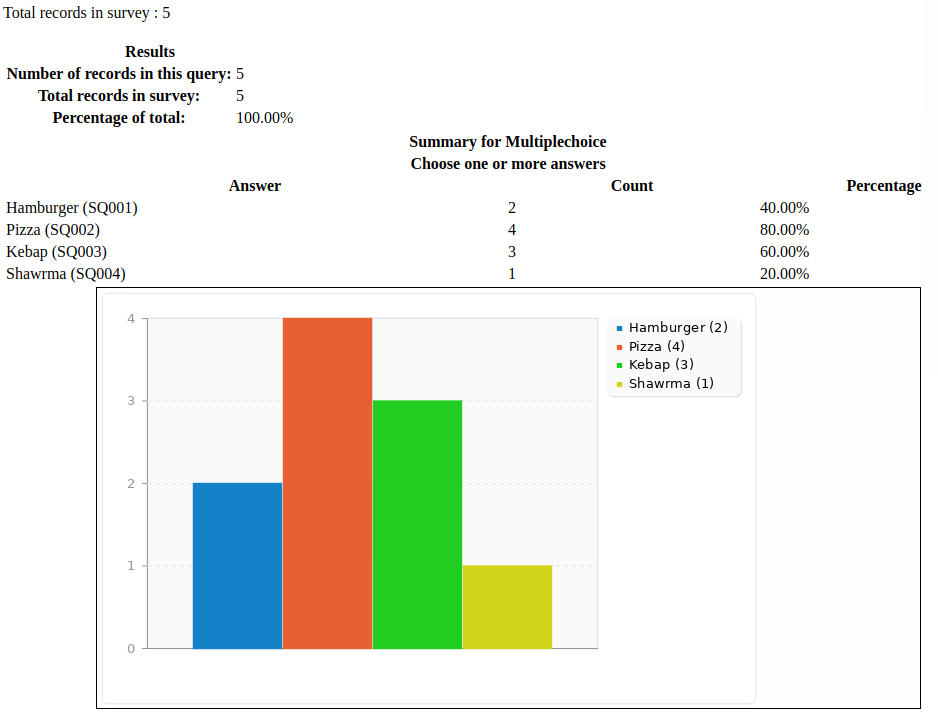
The survey statistics will be displayed on this page. Graphs can also be displayed by enabling the Display chart question attribute:
Changing the look of the public statistics page
The apprearance of the public statistics page can be modified via template.css (search for "#statsContainer"). However, there is currently no template on it's own that can be edited in the LimeSurvey theme editor.
Hints & tips
Feel free to edit the following wiki sections to let other LimeSurvey users learn about statistics-related hints & tips.
Wrong font when exporting statistics - what to do?
For some languages (like Chinese), the usual font used (Vera) does not cover the needed character set. In that case you can use the setting $chartfontfile to set a new TTF font file in config.php (Check out config-defaults.php for the right setting). For Chinese (Simplified and Traditional), another font has to be used such as the FireFlySung font which can be downloaded from github.
FAQs
5 Point choice question type - what do the values located under the "sum" column represent?
In the screenshot below, notice that the "Sum" column shows the aggregated values in the following way:
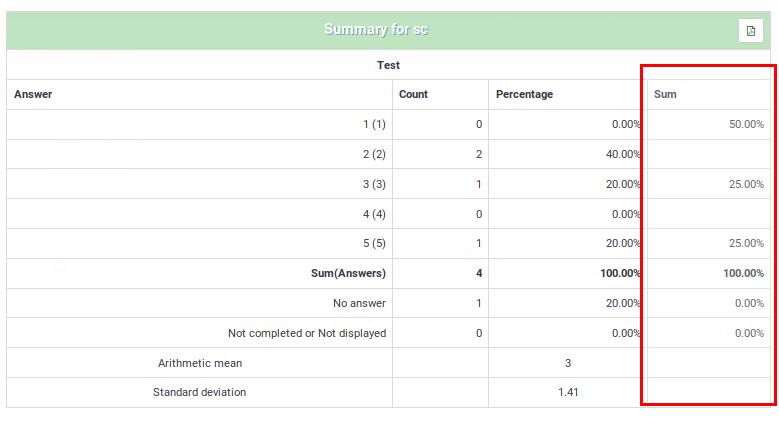
The grouping from the "Sum" column was done in this way because, when rating questions, survey administrators usually interpret the results in this way:
- Y percent of the participants DISLIKE item ABC, where Y represents the percentage of those who answered "1" and "2"
- X percent of the participants LIKE item ABC, where X represents the percentage of those who answered "4" and "5"
- Z percent of the participants have a NEUTRAL opinion about item ABC, where Z represents the percentage of those who answered "3"
| Answer | Count | Sum |
|---|---|---|
| 1 | 0 | 50% (the percentage of those who answered "1" and "2") |
| 2 | 2 | |
| 3 | 1 | 25% (the percentage of those who selected "3" - the neutral option) |
| 4 | 0 | |
| 5 | 1 | 25% (the sum of those who answered "4" and "5") |
| Sum (Answers) | 4 | 100% |
| No answer | 1 | 0% (always "0%") |
| Not completed or displayed | 0 | 0% (always "0%") |