Statistics/es: Difference between revisions
From LimeSurvey Manual
Maren.fritz (talk | contribs) No edit summary |
Maren.fritz (talk | contribs) (Created page with "Para ver qué preguntas pueden hacer uso de estadísticas y/o gráficos, lea la entrada del manual de cada tipo de pregunta aquí. Si la pestaña de est...") |
||
| Line 160: | Line 160: | ||
Para ver qué preguntas pueden hacer uso de estadísticas y/o gráficos, lea la entrada del manual de cada tipo de pregunta [[Tipos de preguntas|aquí]]. Si la pestaña de estadísticas está disponible, verifique qué opciones se muestran en esta pestaña. Hay tres atributos de estadísticas: [[QS:Tipo de gráfico|tipo de gráfico]], [[QS:Mostrar gráfico|mostrar gráfico]] y [[QS:Estadísticas públicas|estadísticas públicas]].</div> | |||
=="Incomplete responses", "no answers" and "not completed/not displayed" count== | =="Incomplete responses", "no answers" and "not completed/not displayed" count== | ||
Revision as of 07:26, 7 September 2023
Generales
El propósito de una encuesta es "obtener respuestas a las preguntas". Una vez que haya creado, activado e invitado a los participantes a completar su encuesta, puede utilizar la funcionalidad Respuestas y estadísticas para recopilar y analizar los resultados de la encuesta y obtener respuestas.
La función de estadísticas se encuentra en el menú de respuestas de una encuesta activa: Respuestas > Respuestas y estadísticas Respuestas solo está disponible si se ha activado una encuesta.

Haga clic en Estadísticas ubicado en la barra de herramientas superior.

Se mostrará la siguiente página.

Las estadísticas de LimeSurvey se pueden mostrar en modo experto o en modo simple. De forma predeterminada, se muestra modo experto al hacer clic en Estadísticas
Estadísticas - modo experto
Su encuesta ha finalizado y ahora desea comenzar a analizar los resultados. LimeSurvey puede exportar todos los resultados a una hoja de cálculo de Excel o a un archivo CSV.
La función de estadísticas: modo experto le permite 'filtrar' sus datos y recuperar números y resúmenes de diferentes campos. El script de estadísticas no realiza un filtrado muy complejo, pero hay mucha información muy útil que se puede obtener fácilmente.
Ejecutando estadísticas rápidas
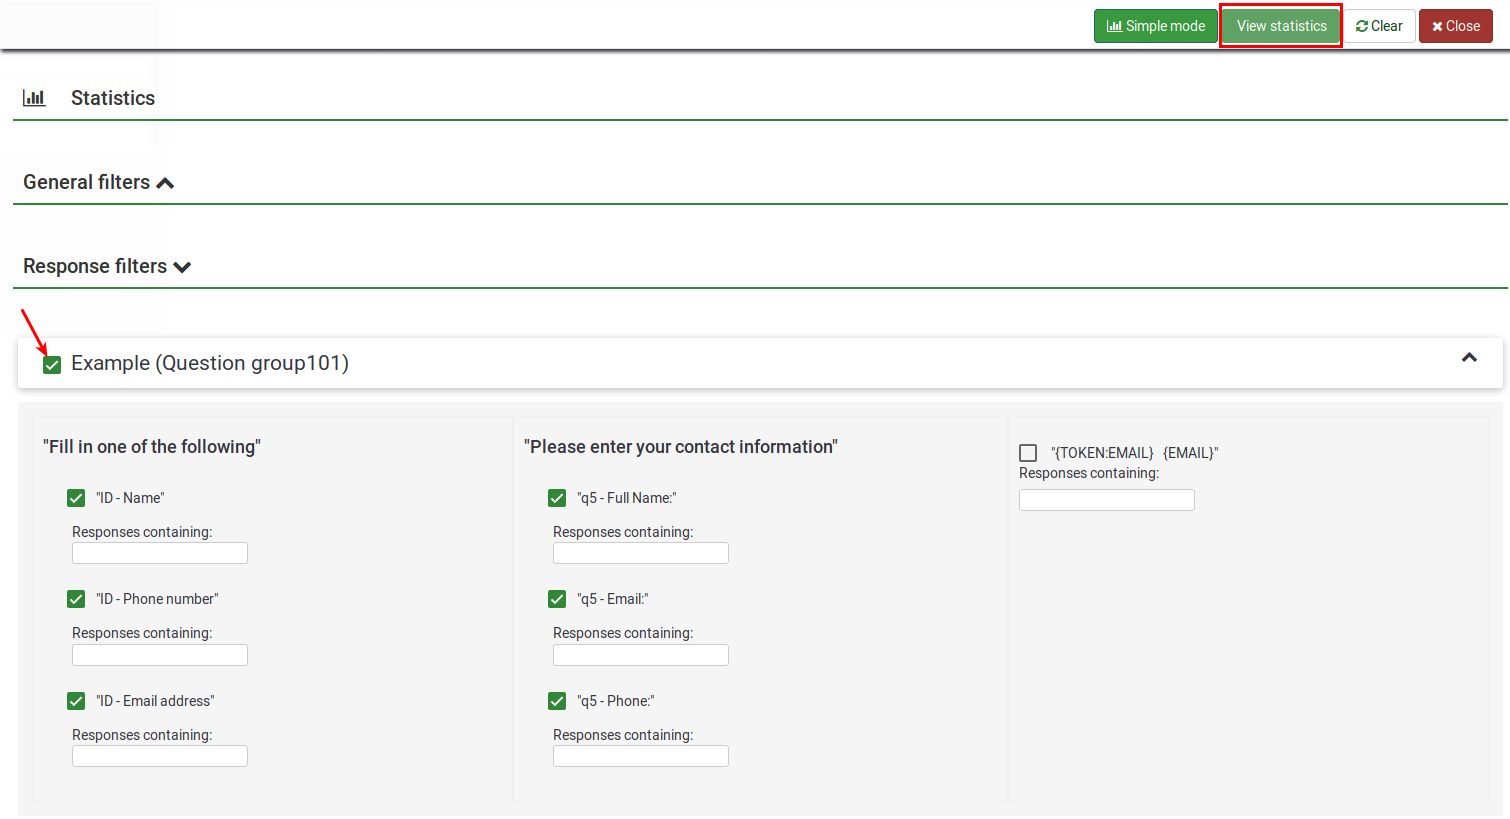
En la captura de pantalla a continuación, puede ver que hay una casilla de verificación para cada pregunta que se puede seleccionar para mostrar un resumen de respuesta para cada pregunta y un ícono que, al hacer clic (o si pasa el mouse sobre él), le brinda la Texto completo de la pregunta. Para ver los resultados de una pregunta o preguntas, marque las casillas de verificación en la parte superior de las preguntas y luego haga clic en "Ver estadísticas".
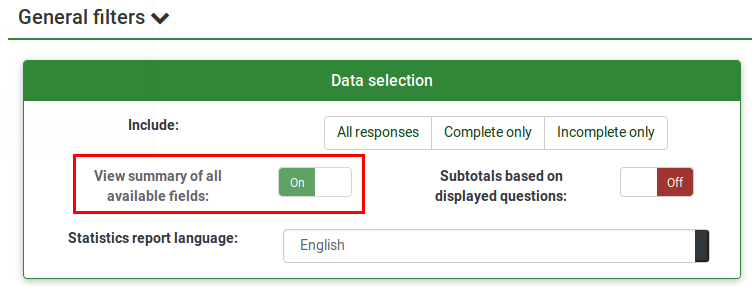
Alternativamente, para ver los resultados de todas las preguntas disponibles, habilite "Ver resumen de todos los campos disponibles" y luego haga clic en "Ver estadísticas".
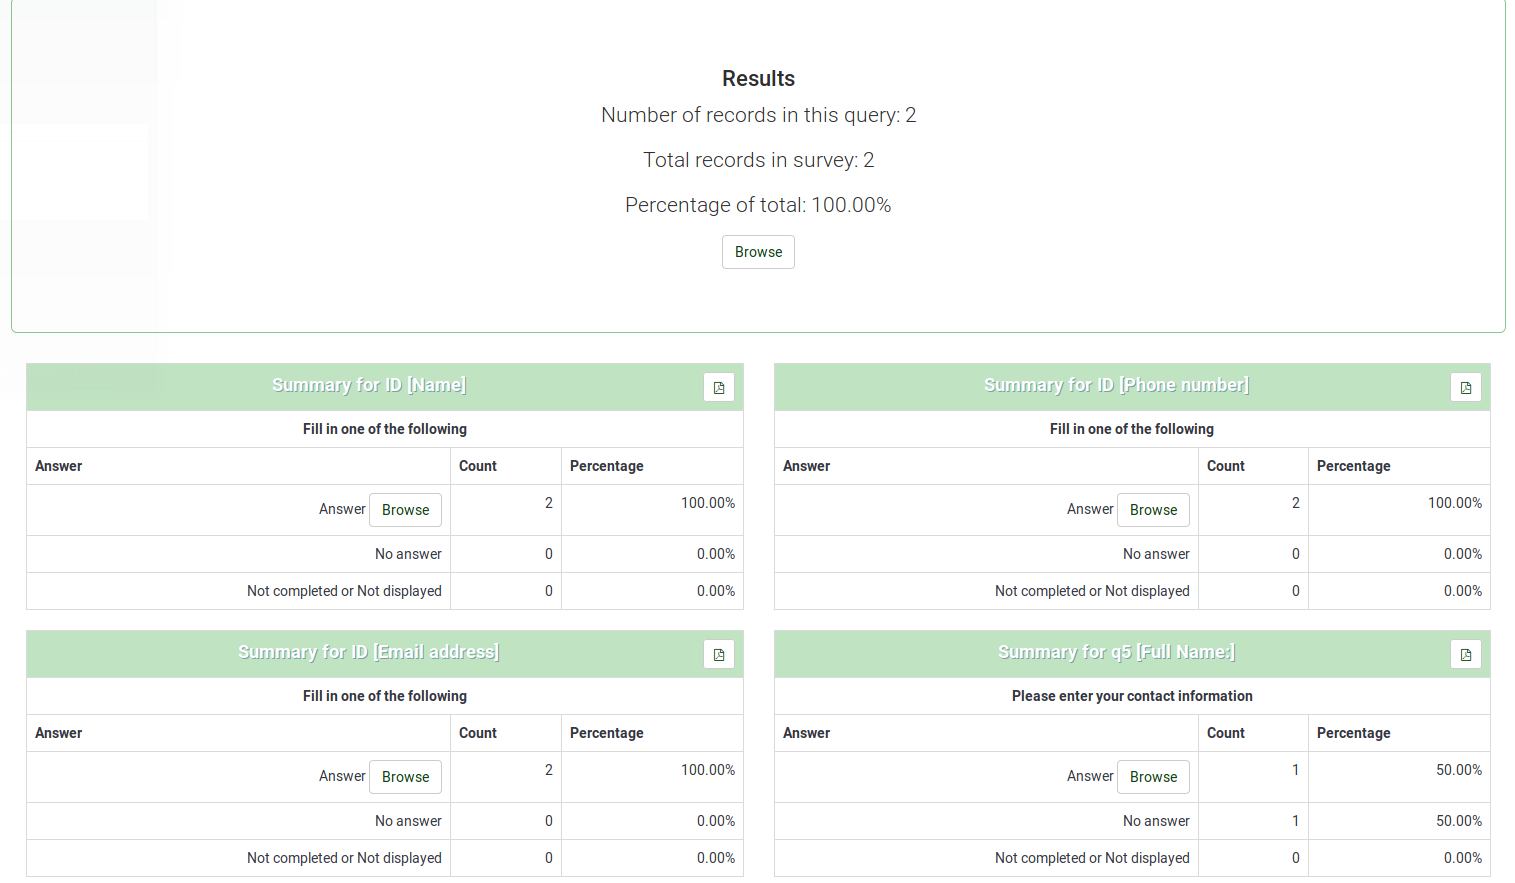
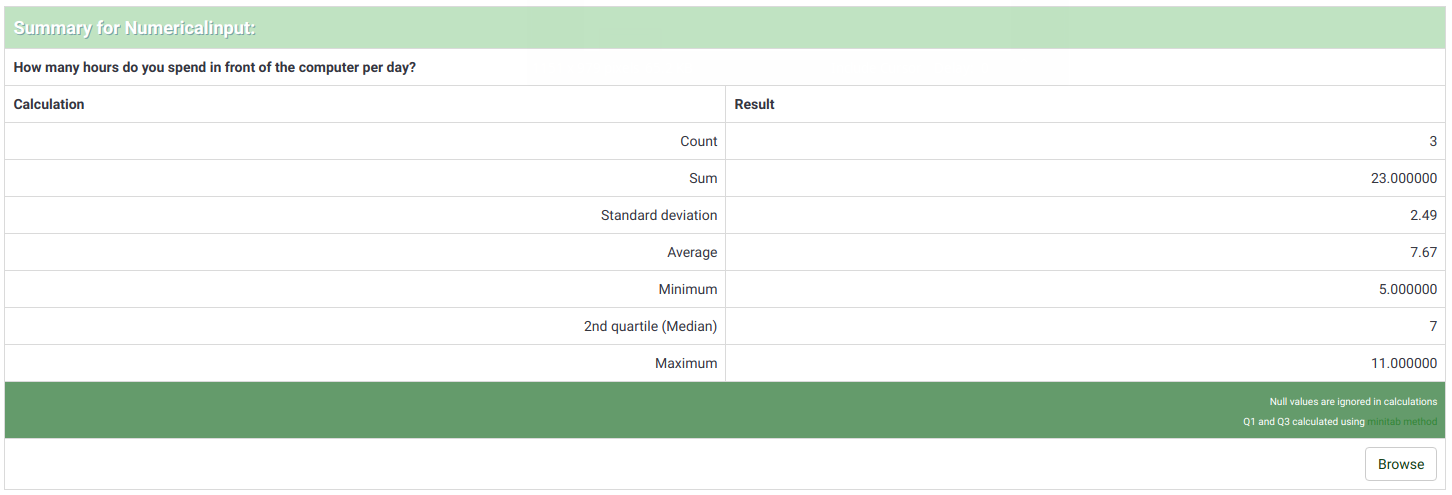
Luego se le entregará una tabla de "Resultados" que indicará el número de casos y una tabla de "Resumen de campo" para cada pregunta seleccionada que resume todas las respuestas posibles en la(s) pregunta(s), sus totales y sus correspondientes. porcentaje.
Filtrar datos
Existen dos tipos de filtros: general y filtros de respuesta.
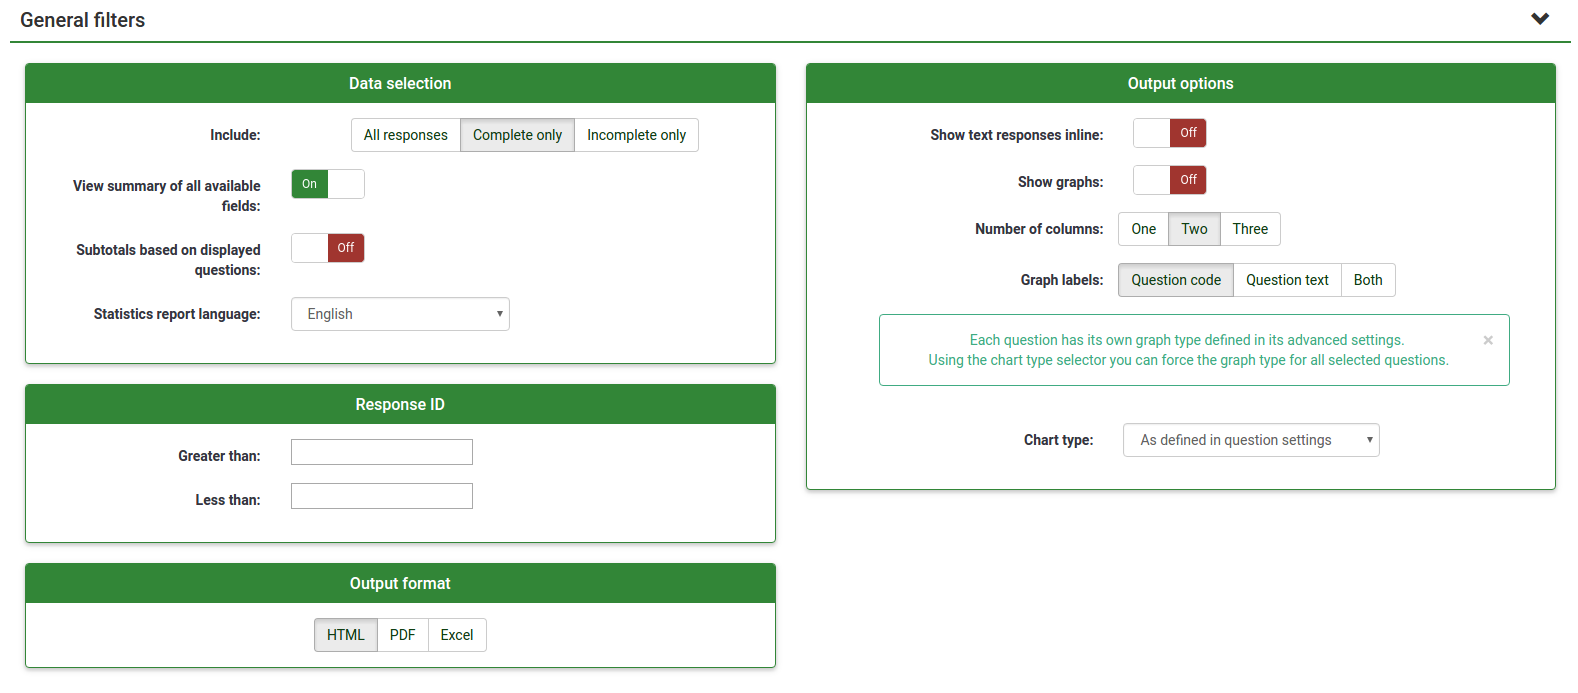
Filtros generales
Como sugiere el nombre, Filtros generales se refiere a filtros a nivel general (macro).
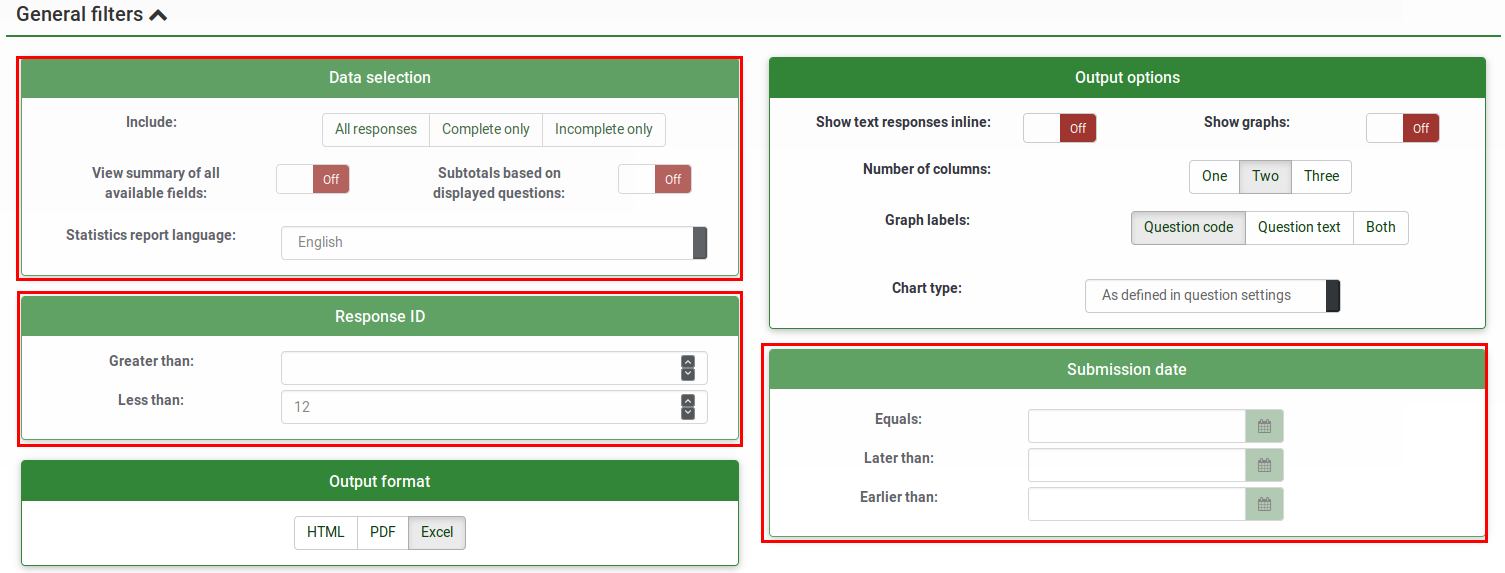
Los filtros pueden estar relacionados con:
- Selección de datos
- El tipo de respuestas:
- Respuestas completas: respuestas que contienen una fecha de envío
- Respuestas incompletas: respuestas que sí no contiene una fecha de envío
- Todos los registros: el número agregado de respuestas completas e incompletas.
- Idioma del informe de estadísticas: si se utilizan idiomas adicionales, esta opción de filtro es útil para dividir a los participantes Según el idioma que utilizaron para completar la encuesta.
- El tipo de respuestas:
- Ver resumen de todos los campos disponibles: Desactivado de forma predeterminada. Al habilitarlo, ¡todas las preguntas y grupos de la encuesta se tendrán en cuenta al ejecutar el script de estadísticas
- Subtotales basados en las preguntas mostradas: Desactivado de forma predeterminada. Cuenta las estadísticas de cada pregunta basándose únicamente en el número total de respuestas para las que se mostró la pregunta (una buena manera de filtrar las respuestas incompletas o sin terminar).
- ID de respuesta: Utilice el número de identificación para filtrar las respuestas recopiladas
- Fecha de envío:Se muestra solo si timings está habilitado. Puede filtrar los datos según la fecha de envío de las respuestas recopiladas.
Para obtener las respuestas filtradas solo según los filtros generales, active la opción "Ver resumen de todos los campos disponibles" y haga clic en el botón Ver estadísticas ubicado en la parte superior derecha de la página pantalla.
Filtros de respuesta
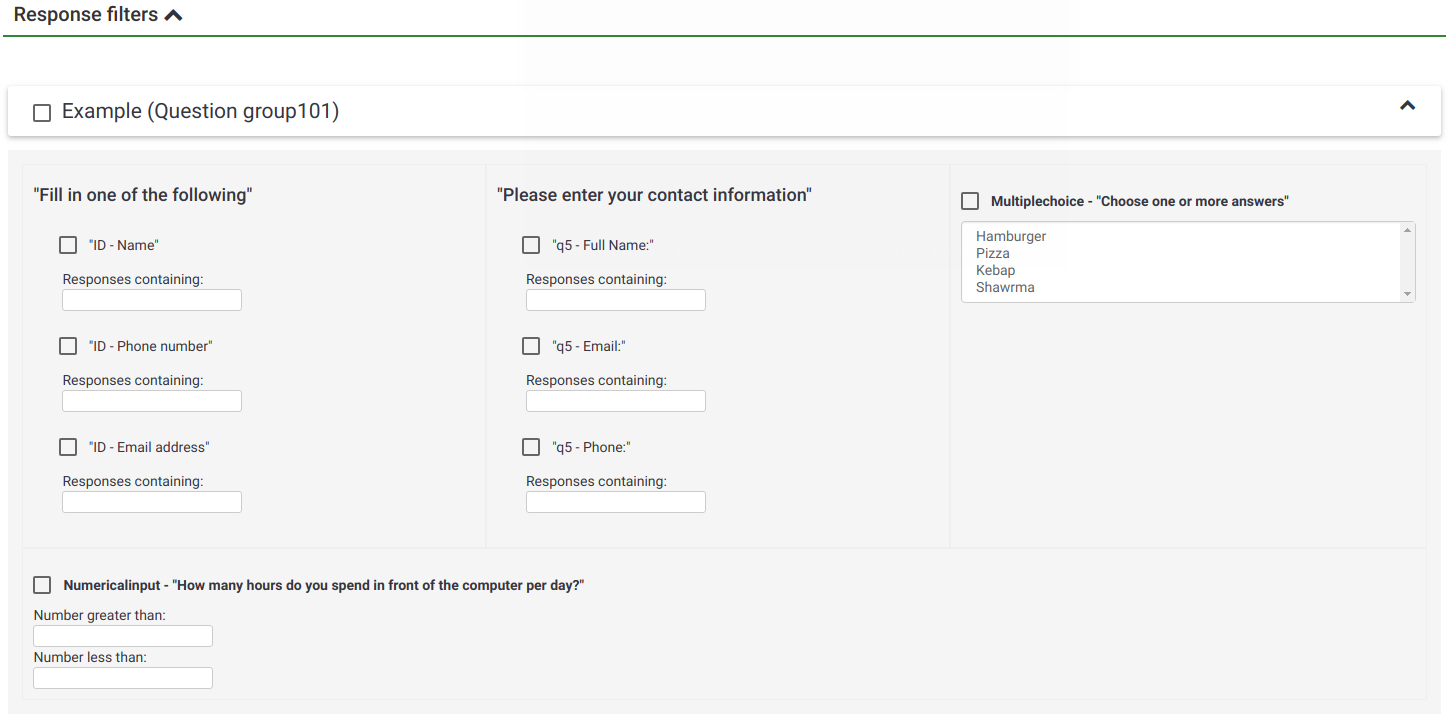
Dependiendo del tipo de pregunta utilizado, se pueden usar diferentes campos para filtrar sus respuestas:
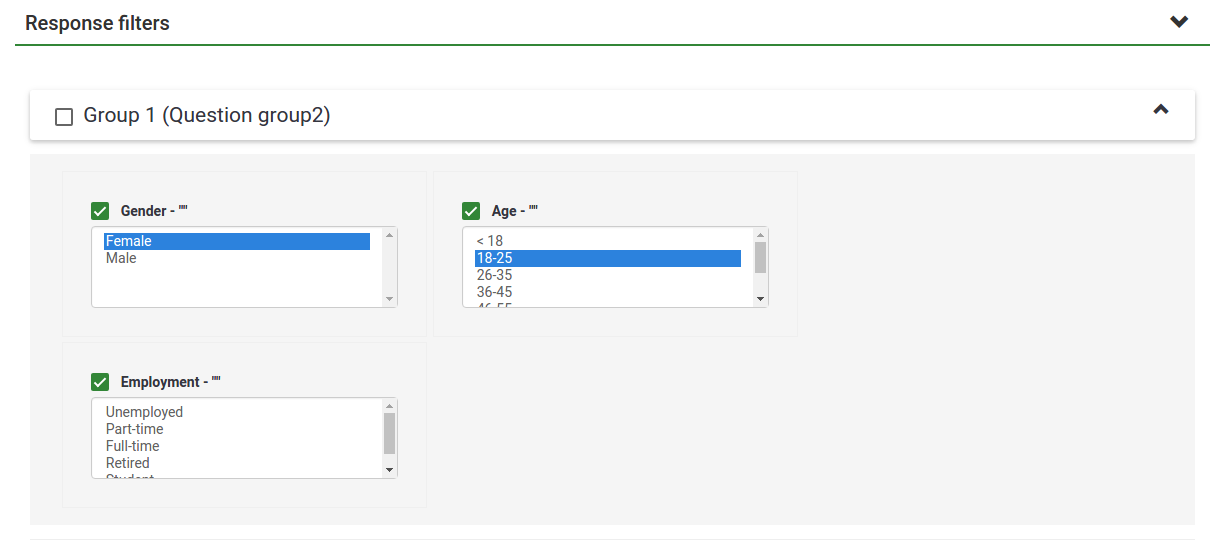
- Por respuesta: Haga clic en una o más respuestas en la lista debajo de cada pregunta para filtrar los datos por esas respuestas (use CTRL/haga clic para seleccionar varias respuestas en la misma pregunta). Tenga en cuenta que si elige ver el resumen de todos los campos disponibles (casilla de verificación en la parte superior), deberá seleccionar sus filtros de respuesta antes de marcar esa casilla.
- Por texto:Puedes buscar las respuestas a un tipo de pregunta de texto libre (y tipos similares) ingresando un texto. Si desea buscar una cadena parcial, puede utilizar el signo de porcentaje (%) como comodín. Por ejemplo: si busca 'Tom%', encontrará entradas con 'Tomb' y 'Tommy', etc.
- Por valor numérico: Puede buscar las respuestas que contienen un determinado valor numérico si se utilizan tipos de preguntas basadas en números.
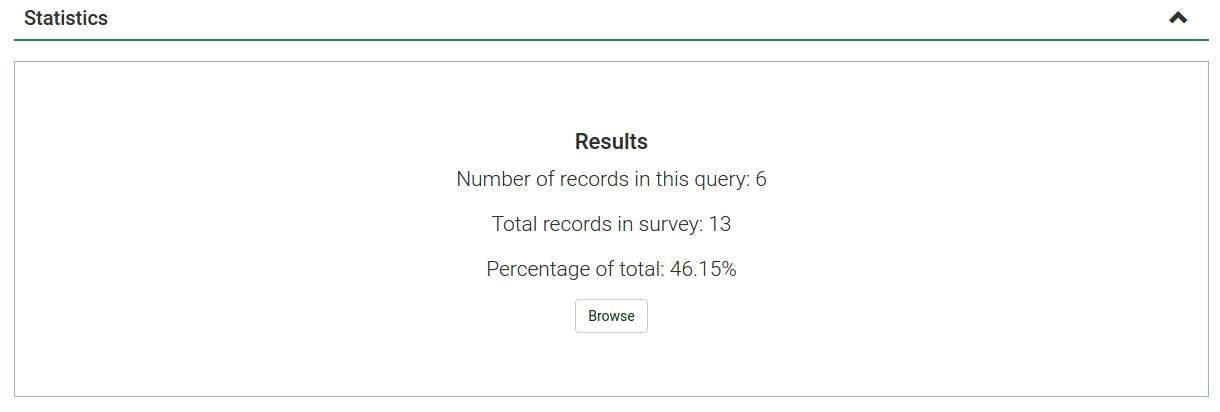
Al seleccionar Ver estadísticas, obtendrá la tabla Resultados, que indica el número de respuestas que coinciden con sus criterios, y una tabla de Resumen de campo para cada pregunta seleccionada que resume todas las respuestas posibles en el pregunta(s), sus totales y su porcentaje. Es importante tener en cuenta que estos resultados son un subconjunto de sus respuestas totales. Entonces, por ejemplo, si sus criterios muestran 146 registros de un total de 180, el resumen mostrará el desglose de solo esos 146 registros para esa tabla.
Las imágenes a continuación indican que el usuario ha elegido ver las estadísticas de "Estado de empleo" de registros completos/mujer/edad 18-25. Esto arroja los resultados de 6 de 13 registros.
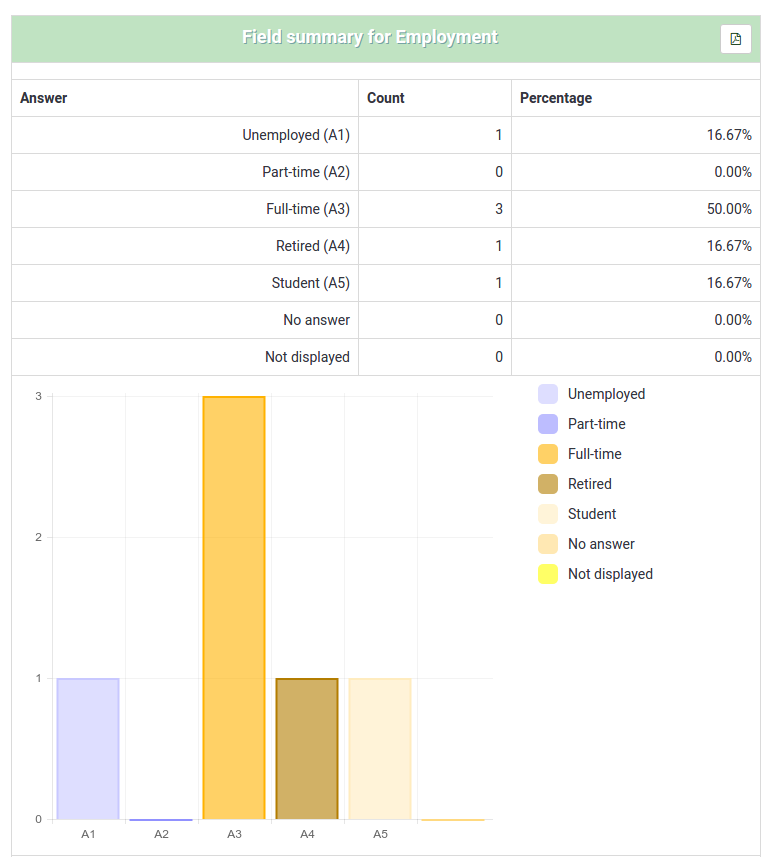
- Si establece criterios en la misma pregunta para la que solicita un resumen, esa pregunta solo presentará respuestas que coincidan con sus criterios. Por lo tanto, es una buena práctica no establecer ningún criterio en la misma pregunta de la que está recibiendo un resumen.
- Para seleccionar varias entradas para una pregunta, mantenga presionado el botón CTRL al hacer clic. Para "anular la selección" del último criterio (si desea borrar todos los criterios de una pregunta), haga clic en la respuesta resaltada respectiva mientras mantiene presionado el botón CTRL.
Gráficos
Para los gráficos se utiliza la biblioteca pChart, que está completamente incluida y normalmente no es necesario configurarla.
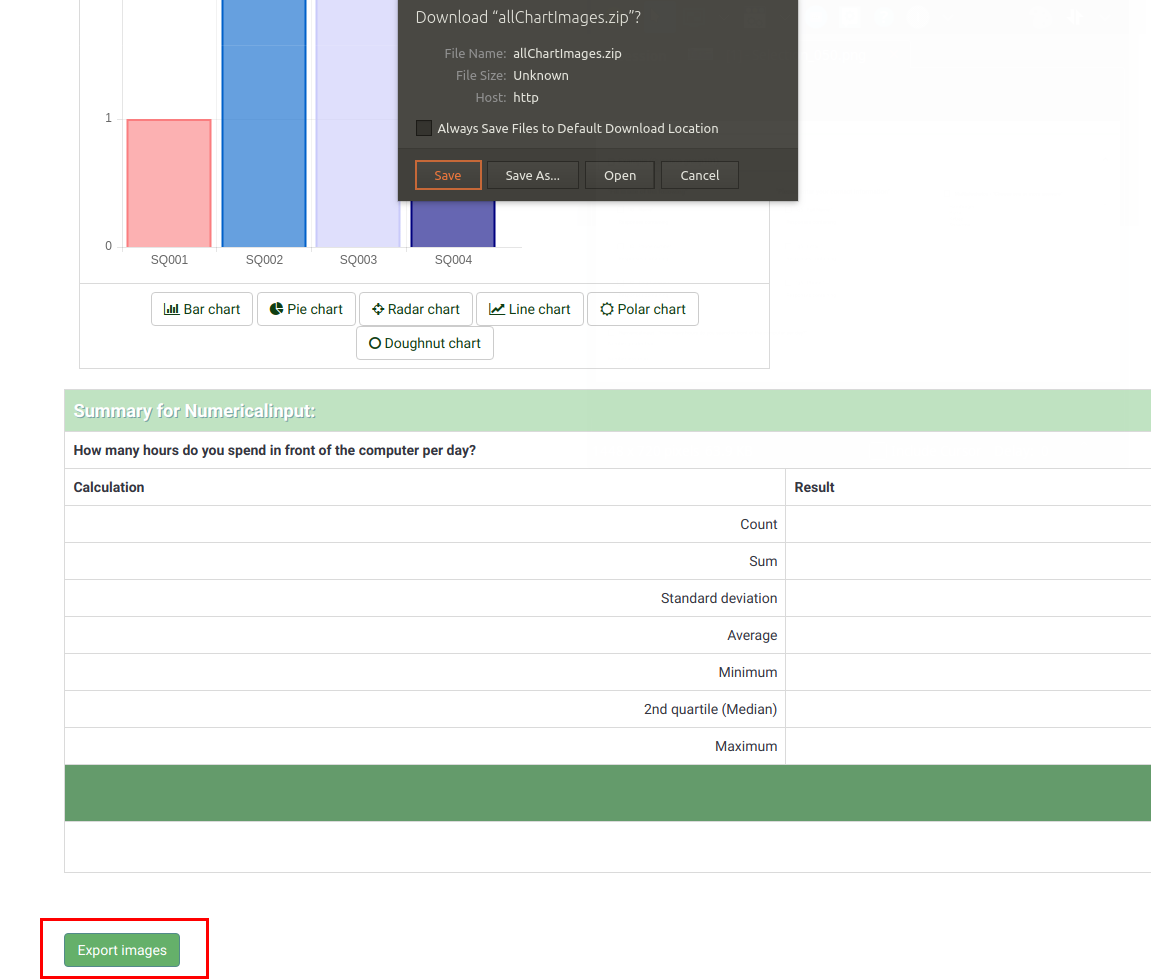
Una vez generados los gráficos, puedes exportarlos fácilmente. Haga clic derecho en el gráfico y elija "Guardar imagen como", luego guarde el gráfico como un archivo .png en la ubicación elegida.
También puedes utilizar la función "Exportar imágenes" para guardar todos los gráficos.
"Incomplete responses", "no answers" and "not completed/not displayed" count
- incomplete responses: All questions started but not completed - the participant clicked the "Next" button in the survey, but did not click the "Submit" button (did not land on the end page of your survey).
There is no SubmitDate in the response table for this entry, but new data set was created already.
- no answer: The question was displayed, but the participant did not an answer.
The question is not mandatory, was displayed, received no answer and the user clicked "Next" or "Submit". The consequence is that the database field for this answer is set to "" (empty string). This "no answer" status cannot be really computed for "Date" or pure "Numerical questions" where the database field cannot record a string.
- not completed/not displayed: The page containing the question was not displayed. This can be because of conditions, or because the participant left the survey before this page was displayed (or while this page is displayed, but without clicking the Next button).
The database field for this question is filled with a NULL value.
Output format and options
The statistics can be displayed in three different formats:
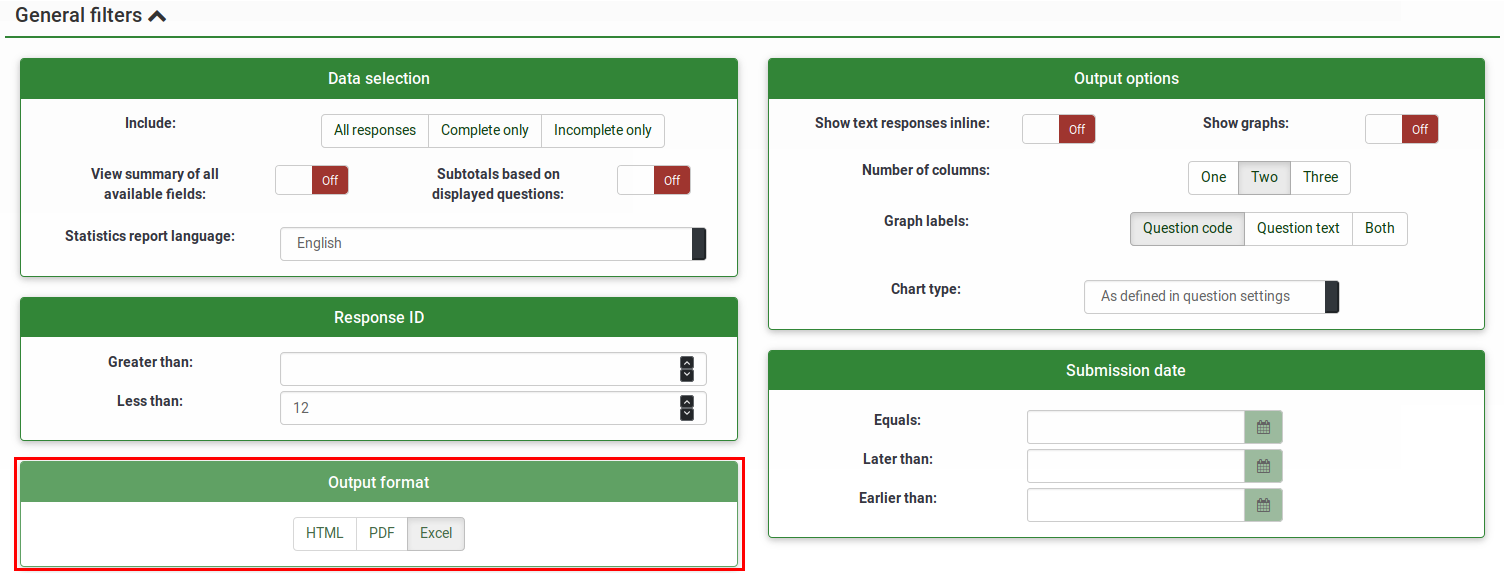
- HTML (default option): The statistics are displayed in LimeSurvey.
- PDF: A popup will be displayed, asking to save the statistics as a PDF file.
- Excel: To further work with your (filtered) data, choose Excel. You can export the file from a spreadsheet application to CSV to work with more advanced statistical tools such as SPSS or R.
The output options can be used to alter the way the statistics are displayed. The following options are available:
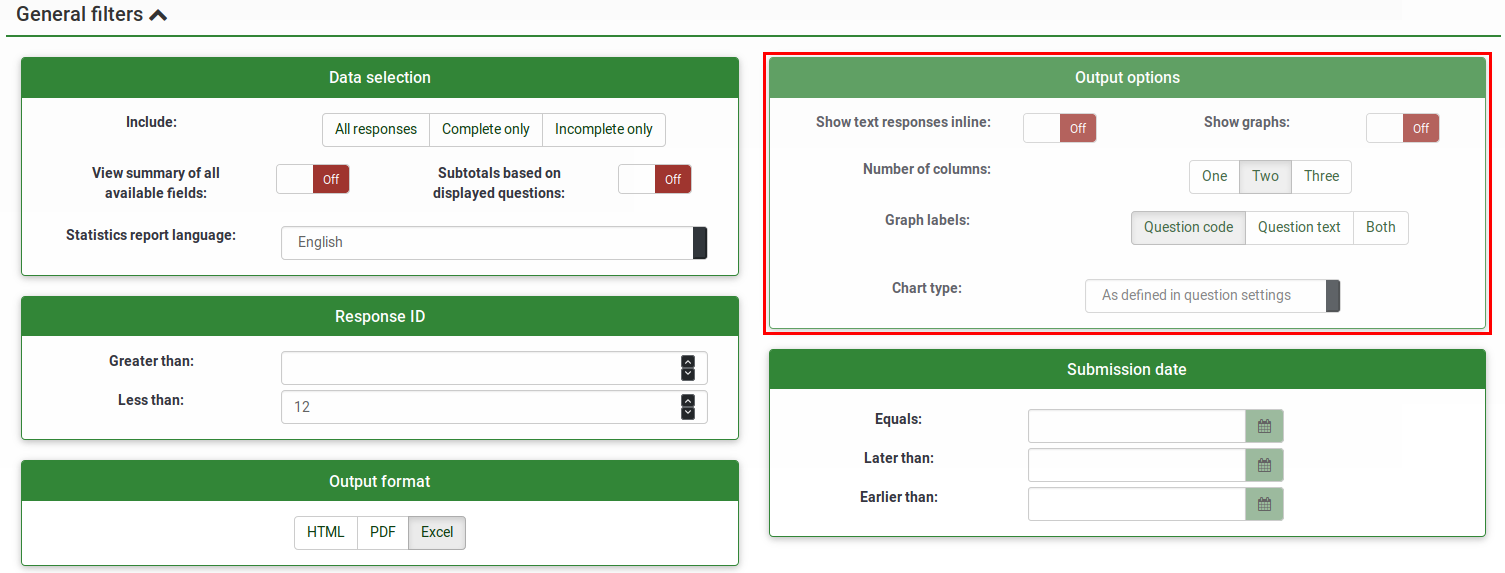
- Show text responses inline: Disabled by default. Shows the text questions responses without having to click a browse button (if enabled; useful for the HTML version of output format)
- Show graphs: Disabled by default. If enabled, graphs will be displayed.
- Number of columns: Two is the default number. If you wish to have statistics and graphs displayed on only one or three columns, choose the desired value from this option. It applies to HTML statistics.
- Graph labels: Choose how the label should look in the graph.
- Question code
- Question text
- Both
- Chart type: the following chart type settings are available:
- As defined in question settings: Useful if you do not want the graph to be displayed. If this is the case, deactivate it from the question settings and select from the "Statistics" panel this option.
- Bar chart
- Pie chart
- Radar chart
- Line chart
- Polar chart
- Doughnut chart
Embed custom logo at statistic PDF
If you want to embed your own logo to the statistics PDF, make sure a file specifically named "statistics.jpg" is placed within the "images" folder of the admin theme used for your system. The admin theme that you would like to use can be set in Global Settings.
Statistics - simple mode
The simple mode was created to provide simple bar chart statistics that can be quickly exported and saved, and then included into a presentation:
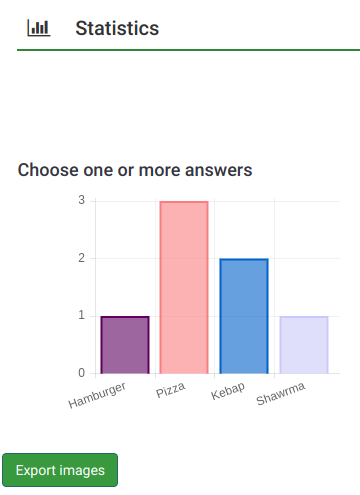
Fewer graphs are displayed than in the expert mode. While in the export mode you can display graphs with respect to those who filled out the survey, did not answer it or did not complete it. the simple mode displays only statistics that rely on the "countable" data submitted by the participants (e.g., single or multiple choice questions as well as array questions).
There is only one option to filter the data within the simple mode - via the responses to be included in the statistics. As a result, the statistics may include the complete responses, incomplete responses, or all responses (the aggregated sum of the first two options). This option is located in the upper-right part of the panel.
To switch back to expert mode, click the "Expert mode" button located in the upper-right part of the screen:

Public statistics
LimeSurvey includes the functionality to display simple statistics to the general public or to your participants after they have completed an online survey.
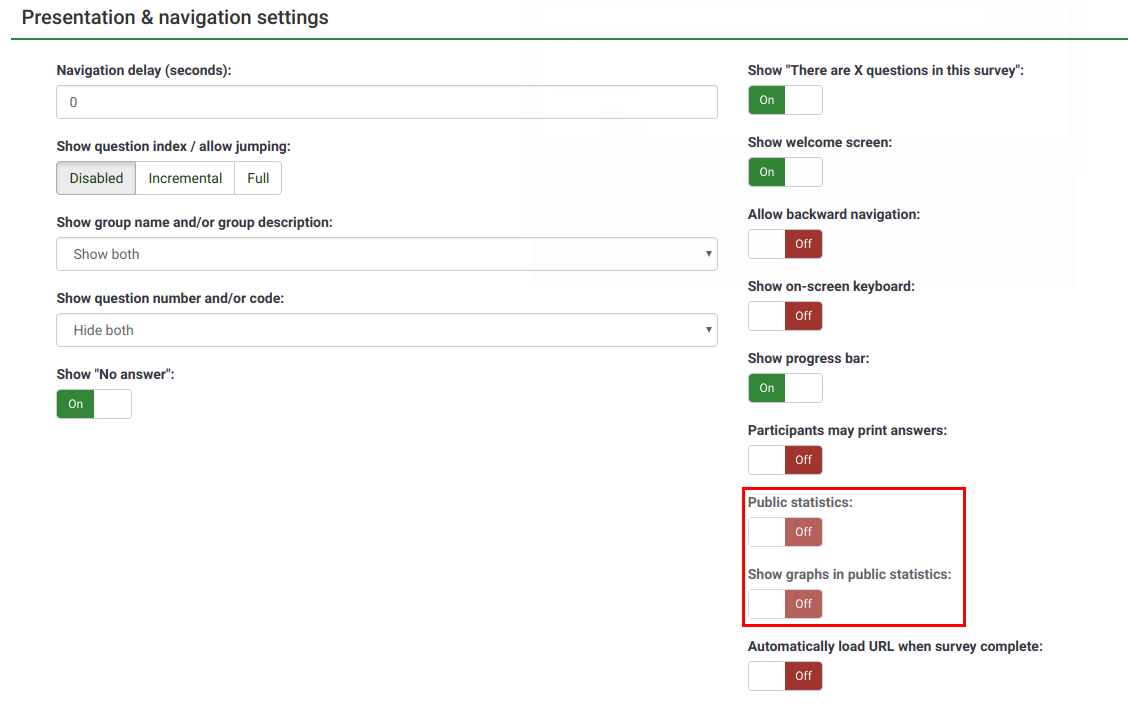
Two components need to be enabled to activate and display statistics to your participants. The first one refers to the public statistics of your survey which must be enabled (it is turned off by default). It is located under the Presentation tab. To also show graphs, look on the same page for the Show graphs in public statistics attribute and enable it (it is disabled by default).
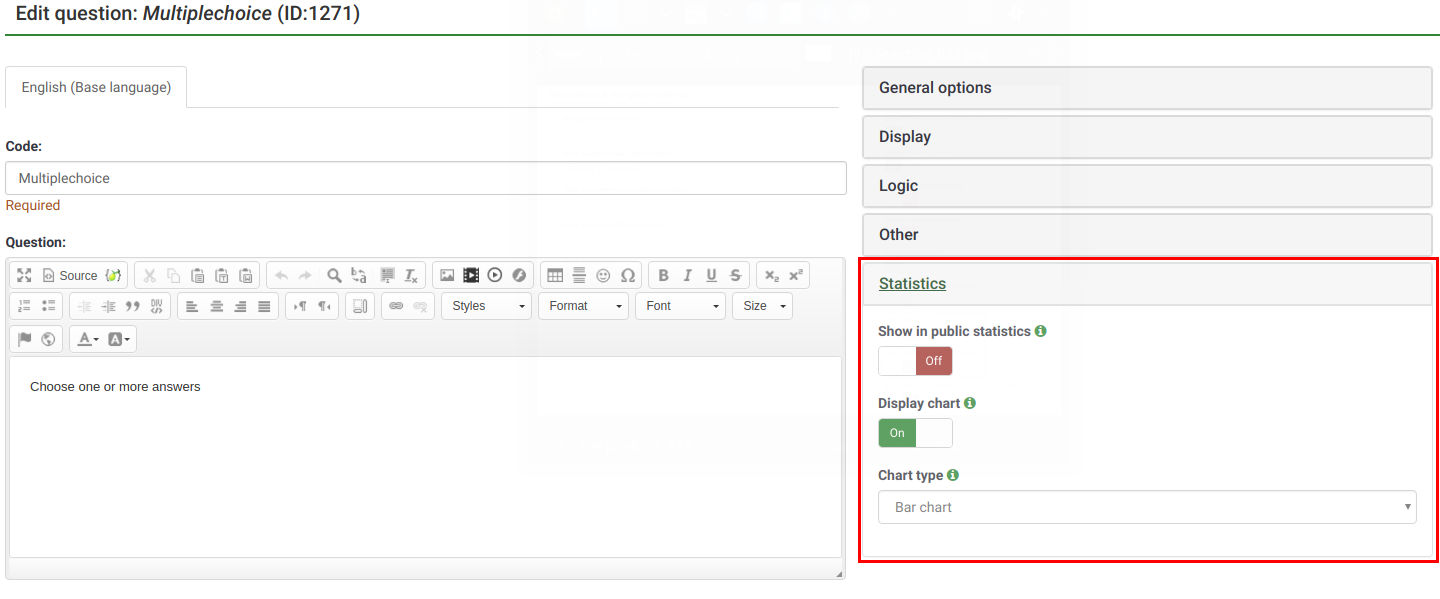
Once you have set your survey to display statistics, you need to indicate question-by-question which statistics you want to be displayed to your respondents. By default, no questions will be displayed. To have them displayed, access the desired question, look for the "Statistics" tab and enable the Show in public statistics attribute.
What participants see
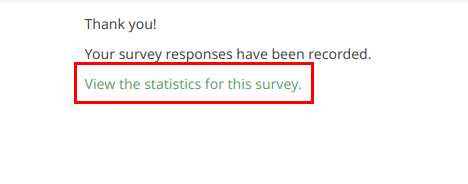
Once you have enabled public statistics and selected some questions to display, an additional option will be visible to participants when they complete your survey. In addition to the usual thank you, there will be a link to "View the statistics for this survey":
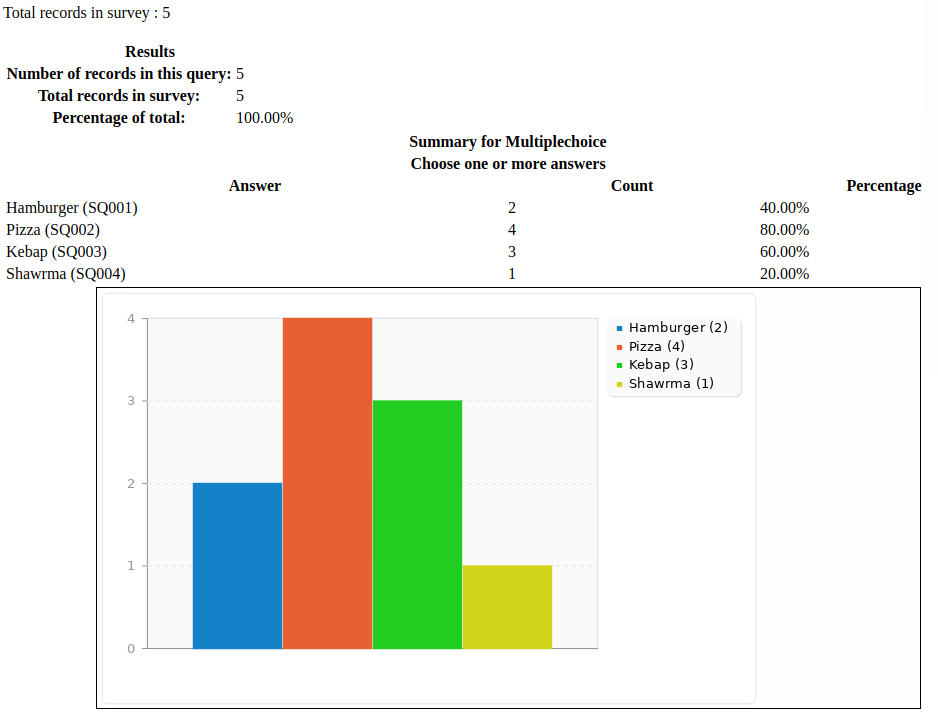
The survey statistics will be displayed on this page. Graphs can also be displayed by enabling the Display chart question attribute:
Changing the look of the public statistics page
The apprearance of the public statistics page can be modified via template.css (search for "#statsContainer"). However, there is currently no template on it's own that can be edited in the LimeSurvey theme editor.
Hints & tips
Feel free to edit the following wiki sections to let other LimeSurvey users learn about statistics-related hints & tips.
Wrong font when exporting statistics - what to do?
For some languages (like Chinese), the usual font used (Vera) does not cover the needed character set. In that case you can use the setting $chartfontfile to set a new TTF font file in config.php (Check out config-defaults.php for the right setting). For Chinese (Simplified and Traditional), another font has to be used such as the FireFlySung font which can be downloaded from github.
FAQs
5 Point choice question type - what do the values located under the "sum" column represent?
In the screenshot below, notice that the "Sum" column shows the aggregated values in the following way:
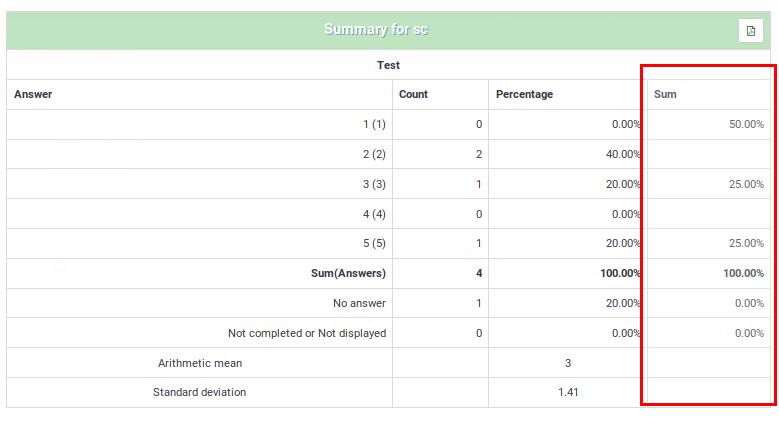
The grouping from the "Sum" column was done in this way because, when rating questions, survey administrators usually interpret the results in this way:
- Y percent of the participants DISLIKE item ABC, where Y represents the percentage of those who answered "1" and "2"
- X percent of the participants LIKE item ABC, where X represents the percentage of those who answered "4" and "5"
- Z percent of the participants have a NEUTRAL opinion about item ABC, where Z represents the percentage of those who answered "3"
| Answer | Count | Sum |
|---|---|---|
| 1 | 0 | 50% (the percentage of those who answered "1" and "2") |
| 2 | 2 | |
| 3 | 1 | 25% (the percentage of those who selected "3" - the neutral option) |
| 4 | 0 | |
| 5 | 1 | 25% (the sum of those who answered "4" and "5") |
| Sum (Answers) | 4 | 100% |
| No answer | 1 | 0% (always "0%") |
| Not completed or displayed | 0 | 0% (always "0%") |