Statistika
From LimeSurvey Manual
Do statistike ankete lahko pridemo preko menija za ogled rezultatov. Le ta je seveda dosegljiva le v primeru, ko je anketa že enkrat aktivirana.
The purpose of a survey is to "get answers to questions". Once you have created, activated and invited participants to complete your survey, you can use the Responses and Statistics functionality to collect and analyze survey results to get answers.
The statistics feature is located under the responses menu of an active survey: Responses > Responses and Statistics Responses is only available if a survey has been activated.

Click Statistics located on the top toolbar.

The following page will be displayed.

The LimeSurvey statistics can be displayed in either expert mode or simple mode. By default, expert mode is displayed when you click Statistics
Kakšna je funkcija statistike?
Za primer si vzemimo aktivno ali že zaključeno anketo, kjer želite narediti analizo rezultatov. LimeSurvey omogoča prenos vseh odgovorov v Excelovo obliko (ali CSV/PDF/HTML datoteko). Ko so enkrat v tej obliki, jih lahko poljubno oblikujete oziroma obdelujete in na ta način analizirate. Lahko pa tudi uporabite funkcijo statistike in s tem pridobite vpogled v analizo vaših podatkov, kjer lahko pridobite kar nekaj koristnih informacij.
Funkcija statistike vam omogoča 'filtriranje' posameznih pridobljenih podatkov oziroma odzivov iz različnih področjih. Skripta statistike ne poizkuša delati kompleksnih filtriranj - vendar boste kljub temu navdušeni nad vrsto informacij, ki jih je mogoče z lahkoto pridobiti.
Ogled rezultatov in povratnih informacij
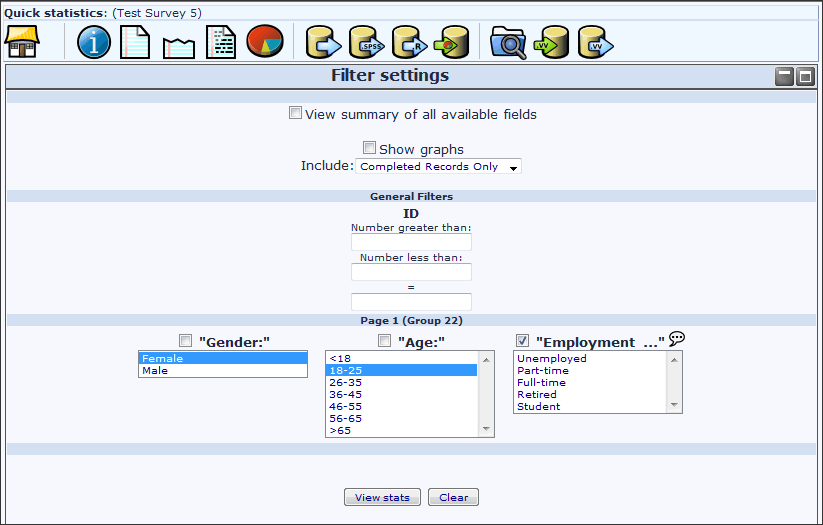
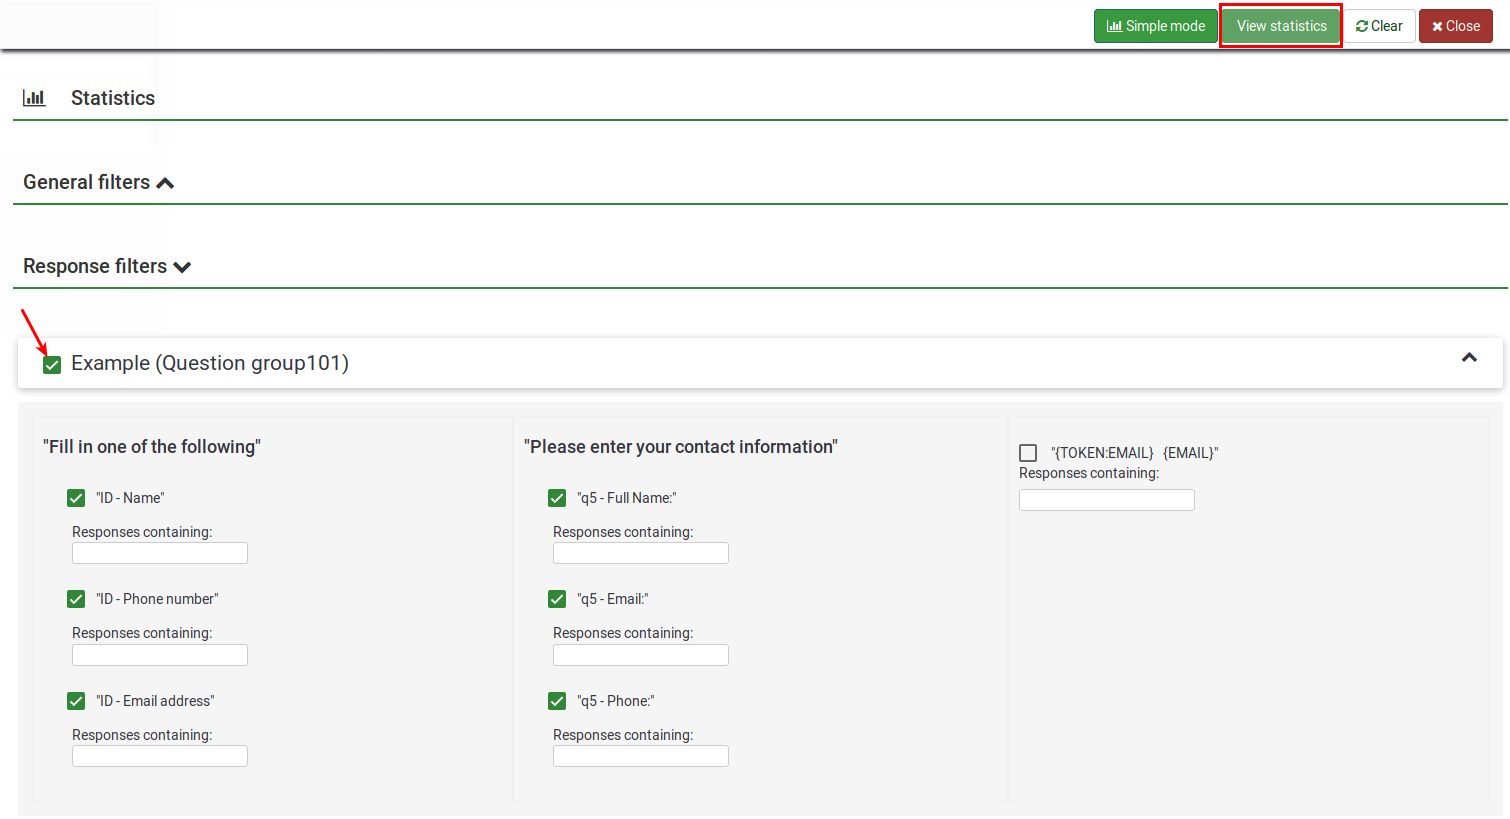
S klikom na "Izdelaj statistiko" vam bo predstavljen seznam vseh možnih vprašanj. Posamezno vprašanje vsebuje potrditveno polje, ki ga lahko kliknete, da se prikaže povzetek tega vprašanja in ikona, ki jo lahko kliknete (ali miško le pridržite na njej) in prikazalo se vam bo celotno besedilo vprašanja. Če si želite ogledati rezultate vprašanja oziroma vprašanj, označite potrditvena polja na vrhu vprašanja in "Poglej statistiko". Druga možnost je, da označite potrditveno polje na vrhu posamezne skupine vprašanj in nato kliknite na gumb "Poglej statistiko".
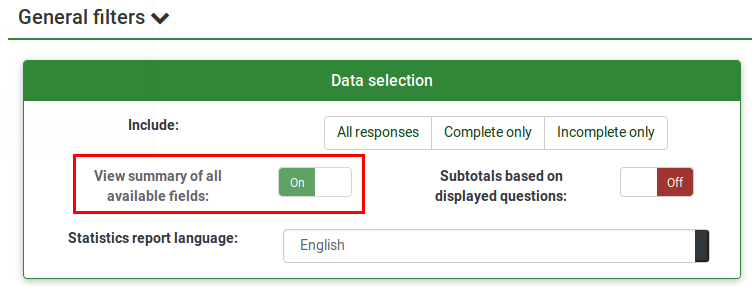
Alternatively, to view the results for all available questions, enable "View summary of all available fields" and then click "View statistics".
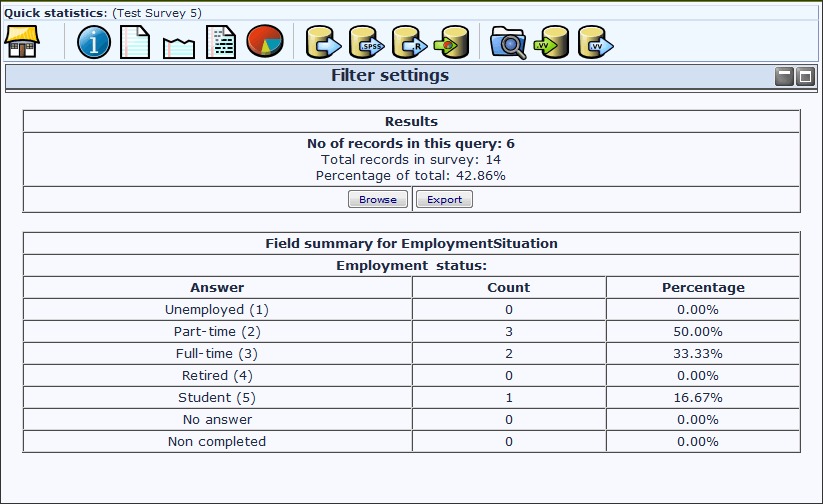
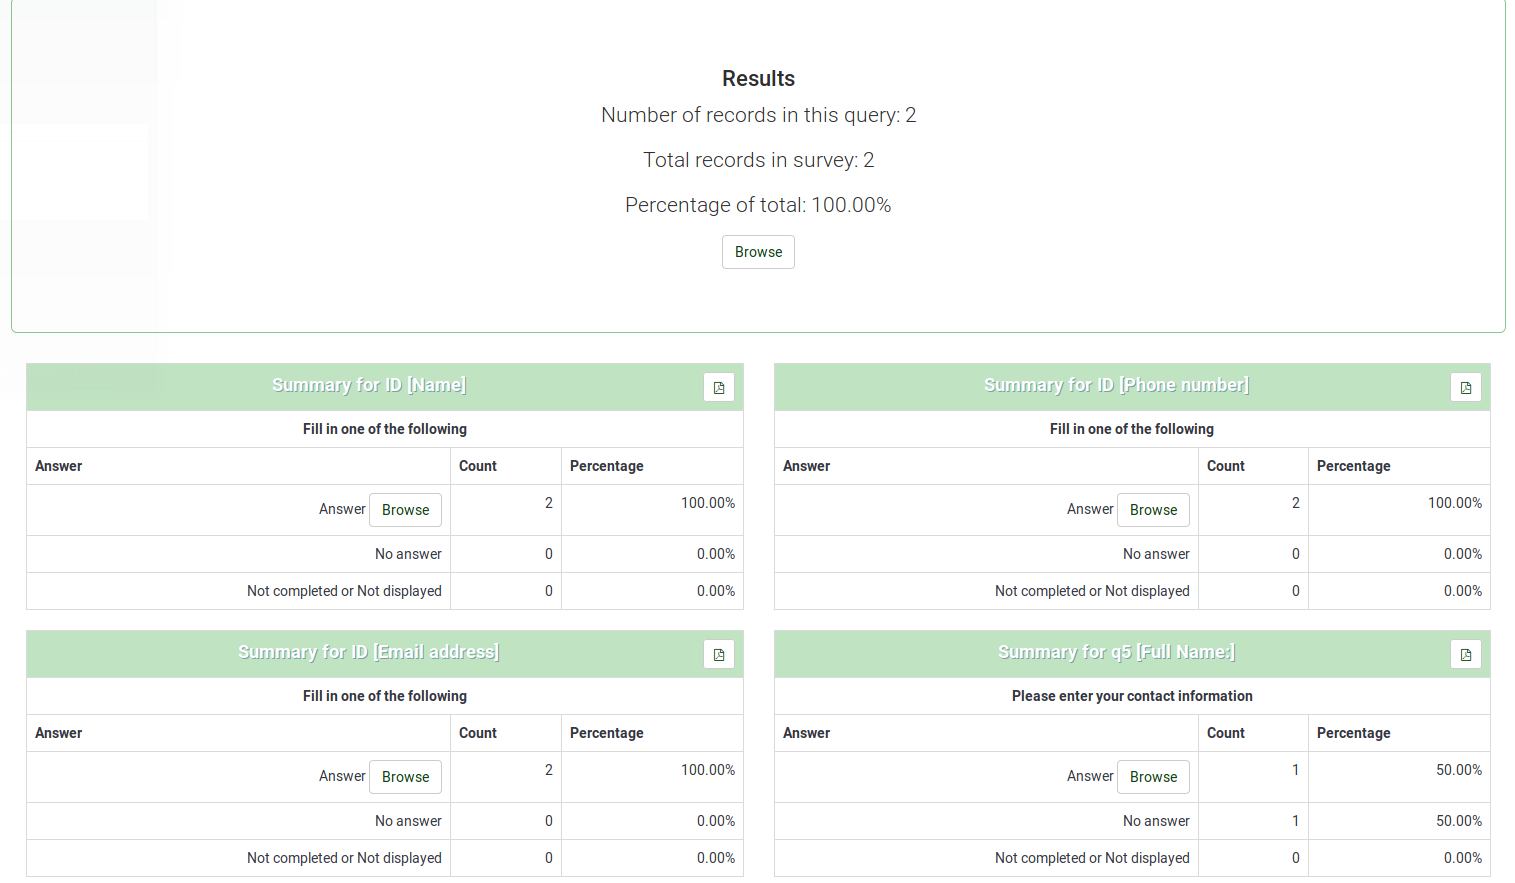
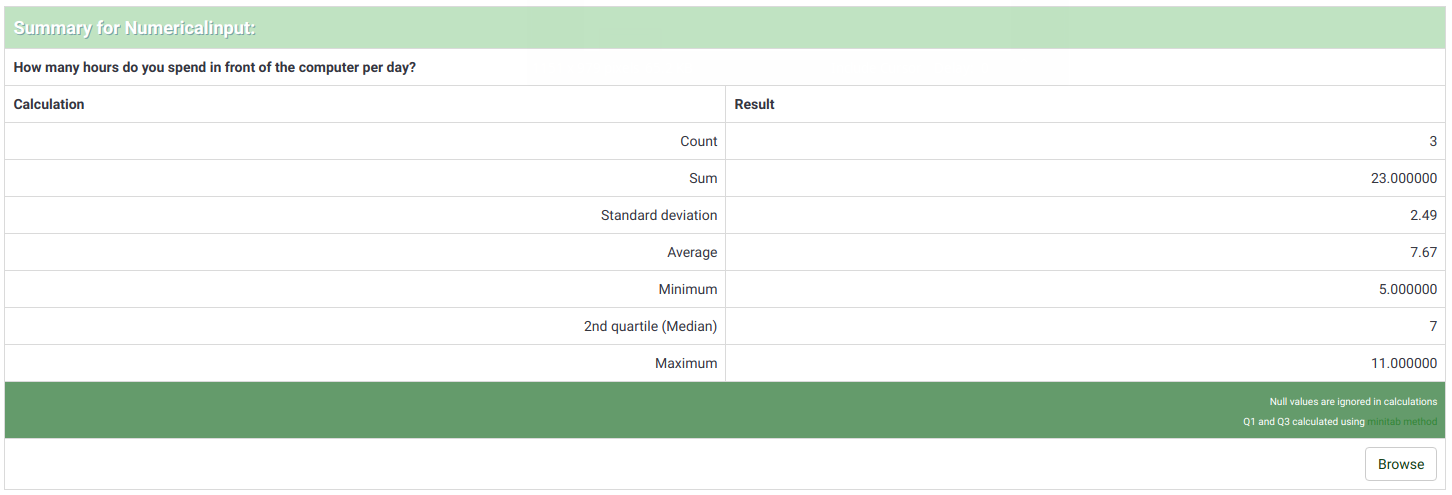
S tem dobite tabelo "Rezultati", ki prikazuje število primerov in tabelo "Povzetek polj" za vsako izbrano vprašanje posebej, ki povzemata vsa možna vprašanja in odgovore, njihove vsote in odstotek.
Filtriranje podatkov
Two types of filters exist: general and response filters.
General filters
Podatke lahko filtrirate na več načinov:
- Po izboru podatkov - v spustnem seznamu lahko izberete naslednje možnosti: Vse odgovore, samo dokončane ankete, samo nepopolni odgovori
- Po ID odgovora - za filtriranje preko ID številk uporabite vhodne podatke
- Po filtru odgovorov - za filtriranje po podatkih posameznih odgovorov izberite enega ali več odgovorov na seznamu, ki se nahajajo pod posameznim vprašanjem (za izbiro več odgovorov iz istega seznama uporabite CTRL). Upoštevajte, da če se odločite, da si ogledate povzetek vseh razpoložljivih polj (potrditvena polja na vrhu), boste morali izbrati želene filtre preden boste označili ta potrditvena polja.
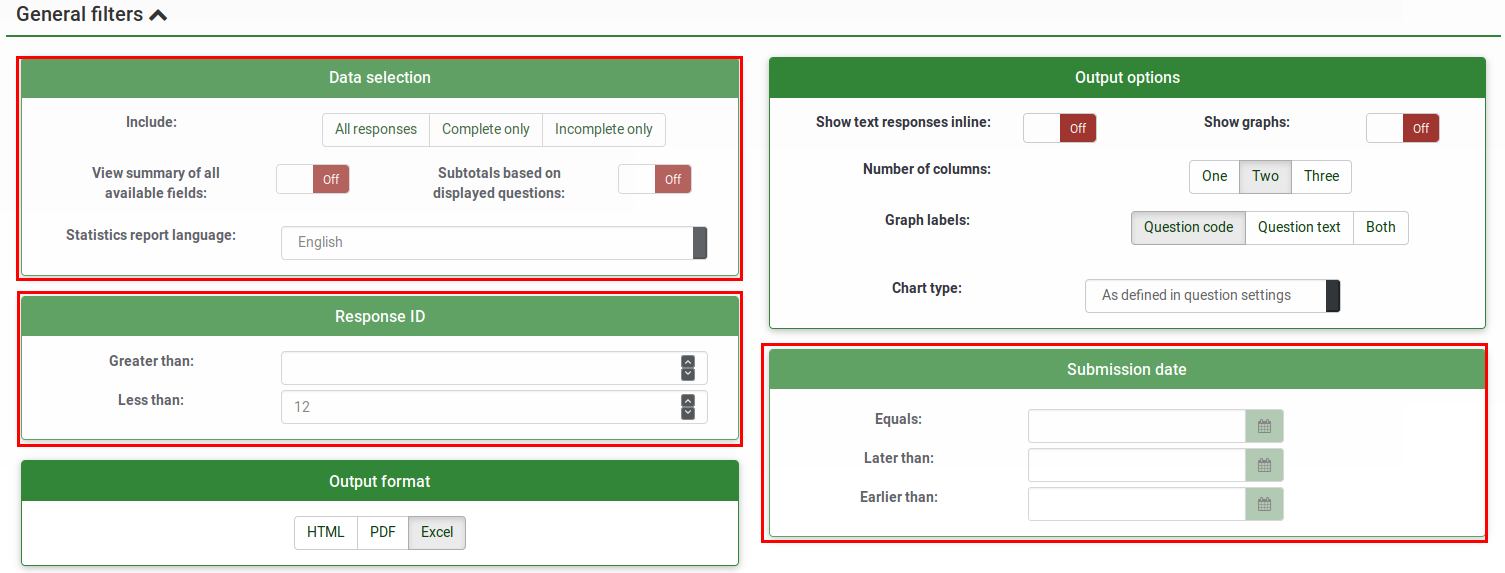
The filters can be related to:
- Data selection
- The type of responses:
- Complete responses: responses that contain a submission date
- Incomplete responses: answers that do not contain a submission date
- All records: the aggregated number of complete and incomplete responses.
- Statistics report language: if additional languages are used, this filter option is useful for dividing participants based on the language they used to fill complete the survey..
- The type of responses:
- View summary of all available field: Turned off by default. By enabling it, all the survey questions and groups will be taken into account when running the statistics script
- Subtotals based on displayed questions: Deactivated by default. It counts stats for each question based only on the total number of responses for which the question was displayed (good way to filter the unfinished/incomplete responses).
- Response ID: Use the ID number to filter your gathered responses
- Submission date:Displayed only if timings is enabled. You can filter the data based on the submission date of your collected responses.
To get the answers filtered according only to the general filters, enable the "View summary of all available field" option and click the View statistics button located in the upper-right part of the screen.
Response filters
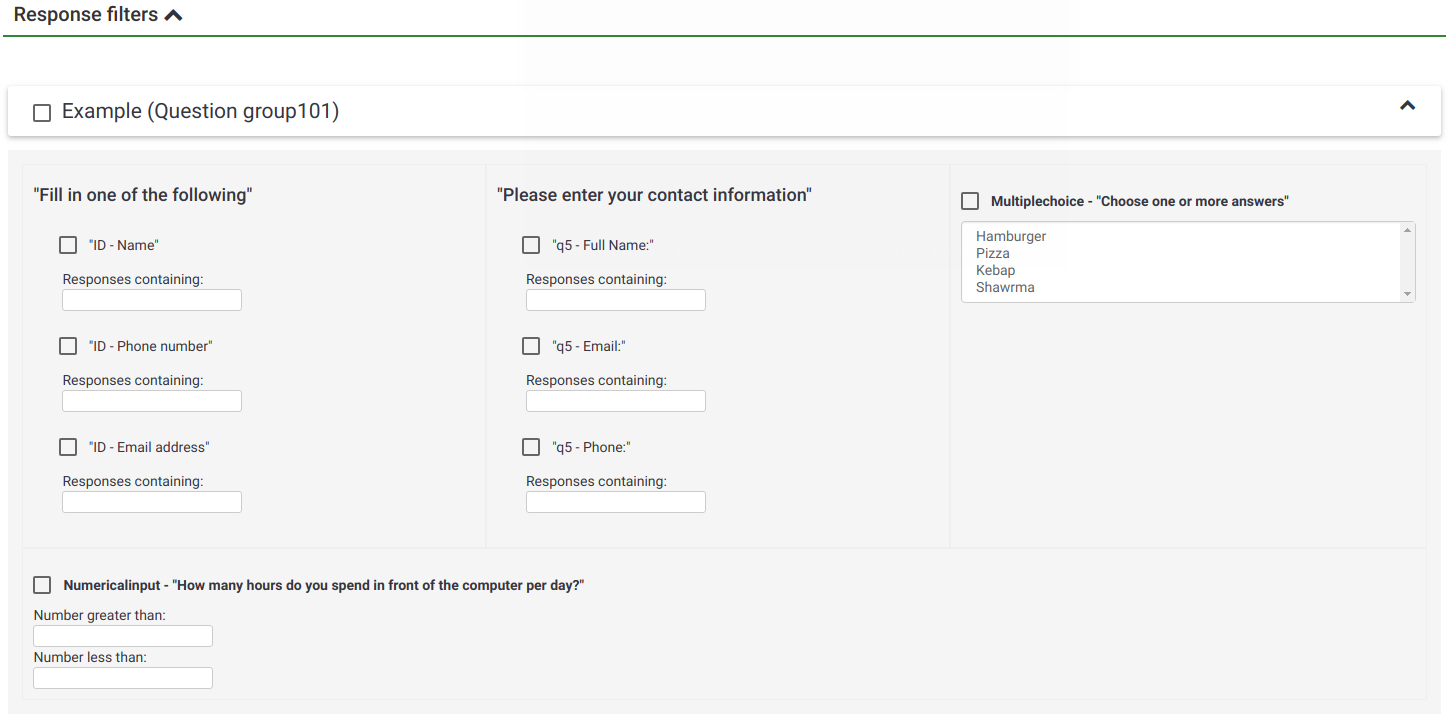
Depending on the used question type, different fields may be used to filter your answers:
- By response: Click one or more responses in the list under each question to filter the data by those responses (use CTRL/click to select multiple responses in the same question). Note that if you choose to view the summary of all available fields (checkbox at top) you will need to select your response filters before checking that box.
- By text:You can search the responses to a free text question type (and similar types) by entering a text. If you want to search for a partial string you can use the percentage sign (%) as wildcard. E.g.: If you look for 'Tom%', it will find entries with 'Tomb' and 'Tommy', etc.
- By numerical value: You can search the responses that contain a certain numerical value if number-based question types are used.
S klikom na "Poglej statistiko" boste imeli možnost vpogleda v tabelo "Rezultati", ki prikazuje število odgovorov na podlagi kriterija, ki ste ga vi predhodno določili. Hkrati se prikaže tabela "Povzetek polja" za posamezno vprašanje, kjer je viden celoten povzetek odgovorov in vprašanj, vsota in njihov odstotek. Pomembno je vedeti, da so ti rezultati podskupina vaših celotnih odgovorov. Za primerjavo: če se na podlagi vašega kriterija prikaže 146 zapisov od 180, bo povzetek prikazal le rezultate teh 146 zapisov.
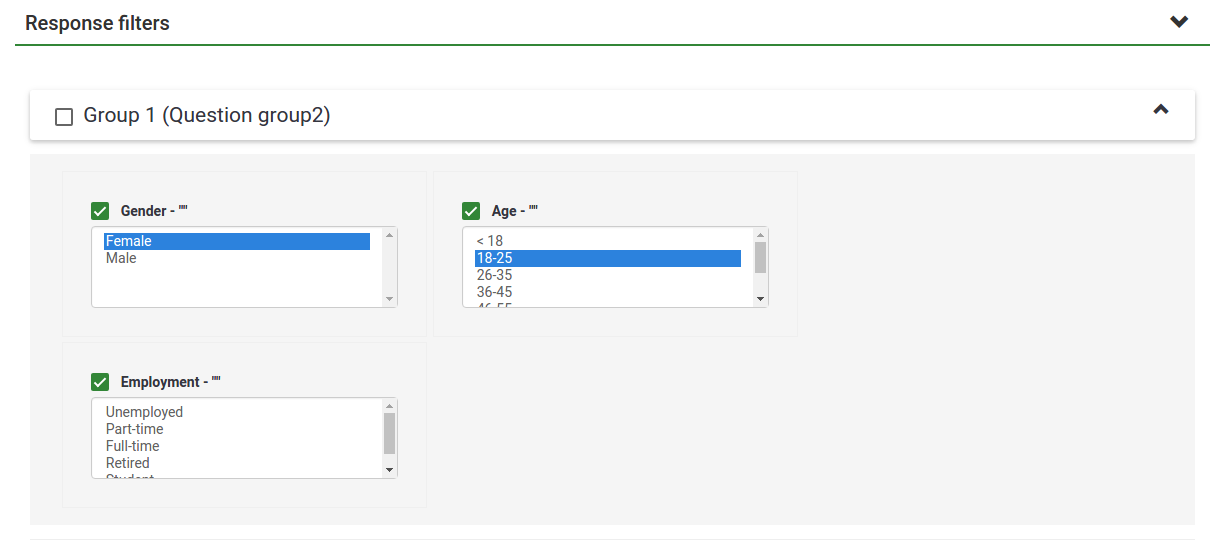
Slika spodaj prikazuje, da želimo vpogled v statistiko za "Status zaposlitve", kjer morajo biti upoštevani naslednji filtri samo dokončane ankete/ženska/starost 18-25. Od 14 zapisov smo pridobili 6 rezultatov.
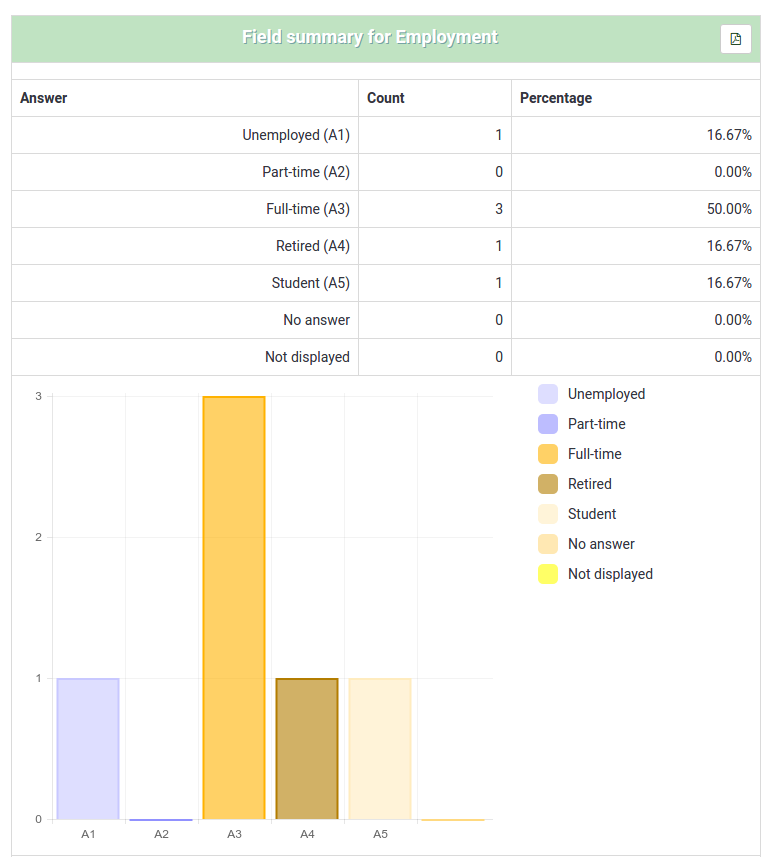
Pozorni bodite na naslednje stvari:
- Če določite kriterij na isto vprašanje od katerega želite povzetek, potem bodo predstavljeni le tisti odgovori tega vprašanja, ki ustrezajo postavljenim kriterijem. Priporočljivo je, da ne postavljate kriterija na vprašanje od katerega pridobivate povzetek.
- Če želite izbrati več vnosov pri istem vprašanju, pri izbiranju držite CTRL tipko. Če želite preklicati zadnje izbran kriterij, ponovno kliknite na že izbran odgovor in pri tem še vedno držimo CTRL tipko.
Grafi
Za izdelavo grafov se uporablja že vgrajena knjižnica pChart, ki je običajno ni potrebno konfigurirati.
Ko so grafi enkrat narejeni, jih lahko na zelo enostaven način izvozite: z miško se postavite na sliko, izvedite desni klik in "Shrani sliko kot". Graf shranite kot .png datoteko na poljubno lokacijo. Običajno so vsi rezultati prikazani s tortnim grafikonom - razen v primeru "Več možnosti", ko so prikazani v obliki stolpičnega grafa.
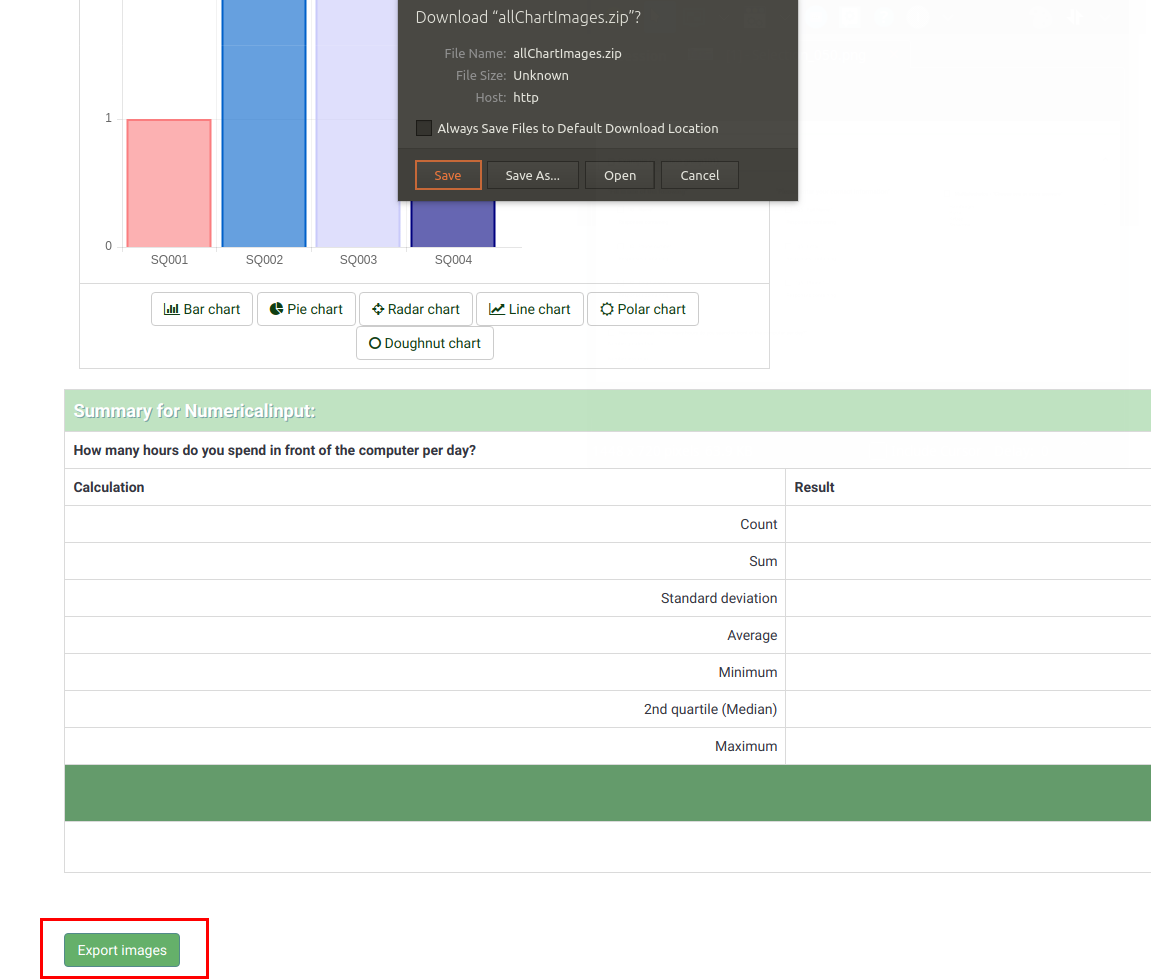
You can also use the "Export images" function to save all the graphs.
"Nepopolni odgovori", "brez odgovora" in "nedokončano/neprikazano" štetje
"Nepopolni odgovori": vsi odzivi, ki so se pričeli vendar niso bili dokončani. Odziv je začet, ko anketiranec v anketi klikne gumb za "Naprej" in nato klikne "Pošlji" na koncu.
Tehnično gledano se to zgodi takrat, ko v tabeli odzivov ni posredovanih podatkov za ta vnos vendar se kljub temu ustvari nov nabor podatkov.
Vprašanje "brez odgovora": vprašanje je bilo prikazano vendar anketiranec ni dal odgovora.
Tehnično gledano se to zgodi takrat, ko prikazano vprašanje ni obvezno in ni prijelo nobenega odgovora, anketiranec pa je kliknil na Naprej oziroma Oddaj: posledica tega je, da se za to vprašanje v podatkovni bazi ustvari prazen niz. Na ta status brez odgovora ne moremo računati pri datumu ali osnovnih številčnih vprašanjih, saj polje v podatkovni bazi ne more posneti niza.
Vprašanje "nedokončano/neprikazano": ko stran vsebuje vprašanje, ki ni bilo prikazano. Razlog za to je lahko zaradi pogoja, ki smo ga postavili in ni bil izpolnjen ali zaradi tega, ker je anketiranec zapustil anketo še preden se je ta stran prikazala (ali jo je zapustil ravno ko se je ta stran prikazala vendar nato ni več kliknil gumba za naprej).
Tehnično gledano se to zgodi takrat, ko se v poljih podatkovne baze nahajajo NULL vrednosti.
Output format and options
The statistics can be displayed in three different formats:
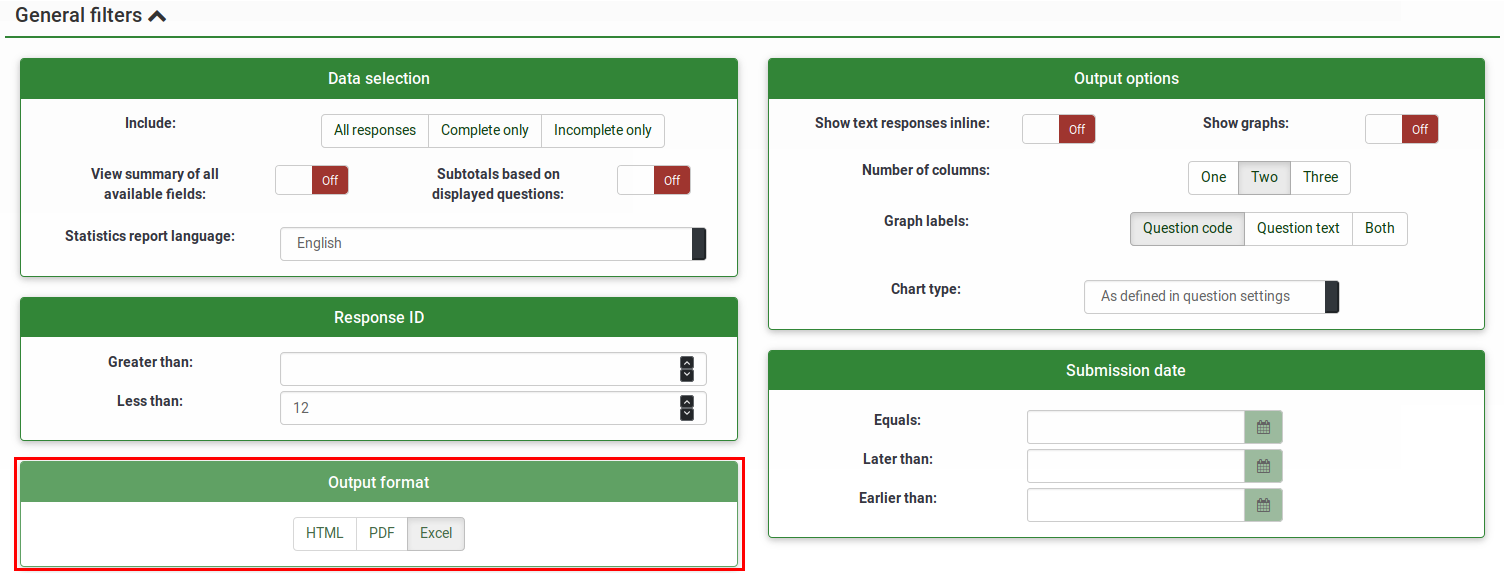
- HTML (default option): The statistics are displayed in LimeSurvey.
- PDF: A popup will be displayed, asking to save the statistics as a PDF file.
- Excel: To further work with your (filtered) data, choose Excel. You can export the file from a spreadsheet application to CSV to work with more advanced statistical tools such as SPSS or R.
The output options can be used to alter the way the statistics are displayed. The following options are available:
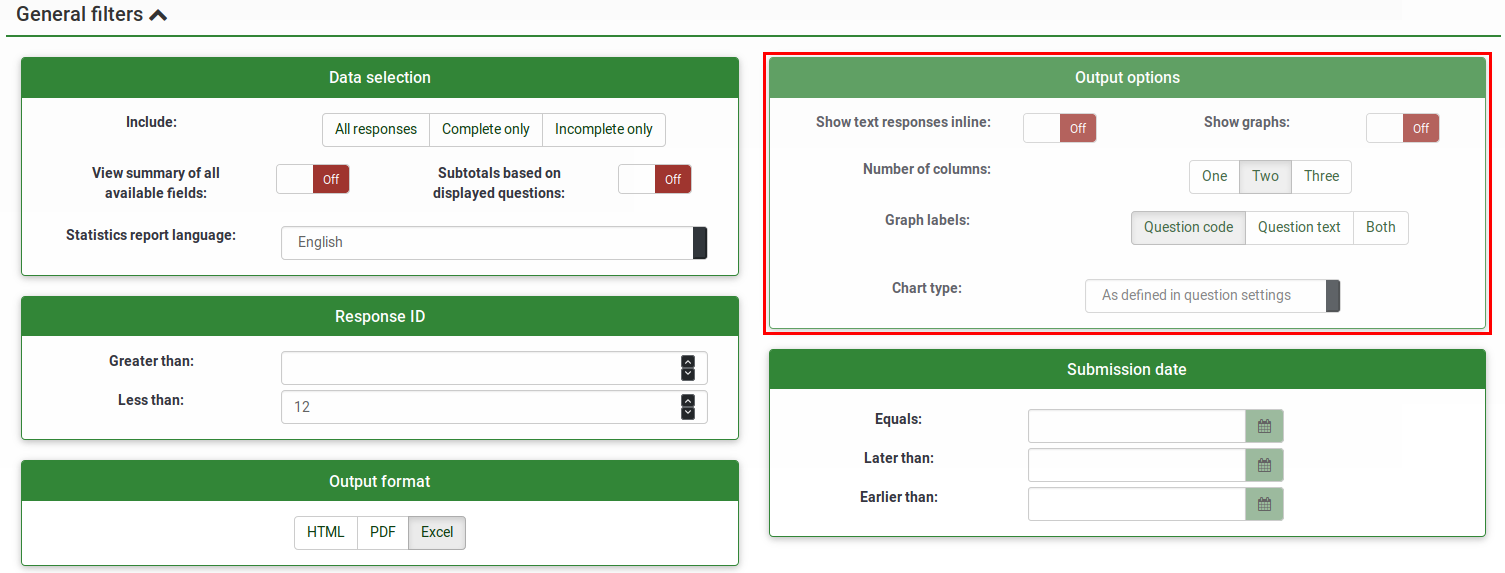
- Show text responses inline: Disabled by default. Shows the text questions responses without having to click a browse button (if enabled; useful for the HTML version of output format)
- Show graphs: Disabled by default. If enabled, graphs will be displayed.
- Number of columns: Two is the default number. If you wish to have statistics and graphs displayed on only one or three columns, choose the desired value from this option. It applies to HTML statistics.
- Graph labels: Choose how the label should look in the graph.
- Question code
- Question text
- Both
- Chart type: the following chart type settings are available:
- As defined in question settings: Useful if you do not want the graph to be displayed. If this is the case, deactivate it from the question settings and select from the "Statistics" panel this option.
- Bar chart
- Pie chart
- Radar chart
- Line chart
- Polar chart
- Doughnut chart
Embed custom logo at statistic PDF
(Available for Limesurvey 3.x since 12/2018)
If you want to embed your own logo to the statistics PDF, make sure a file specifically named "statistics.jpg" is placed within the "images" folder of the admin theme used for your system. The admin theme that you would like to use can be set in Global Settings.
Statistics - simple mode
The simple mode was created to provide simple bar chart statistics that can be quickly exported and saved, and then included into a presentation:
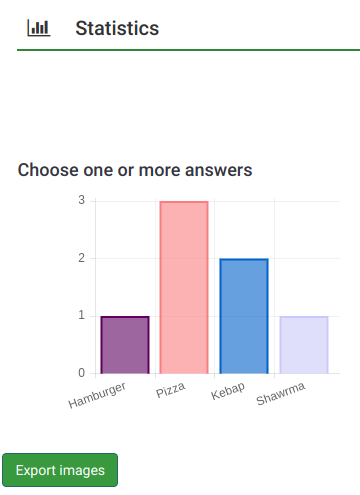
Fewer graphs are displayed than in the expert mode. While in the export mode you can display graphs with respect to those who filled out the survey, did not answer it or did not complete it. the simple mode displays only statistics that rely on the "countable" data submitted by the participants (e.g., single or multiple choice questions as well as array questions).
There is only one option to filter the data within the simple mode - via the responses to be included in the statistics. As a result, the statistics may include the complete responses, incomplete responses, or all responses (the aggregated sum of the first two options). This option is located in the upper-right part of the panel.
To switch back to expert mode, click the "Expert mode" button located in the upper-right part of the screen:

Javna statistika
LimeSurvey omogoča anketirancem po uspešno oddani anketi prikaz preproste statistike.
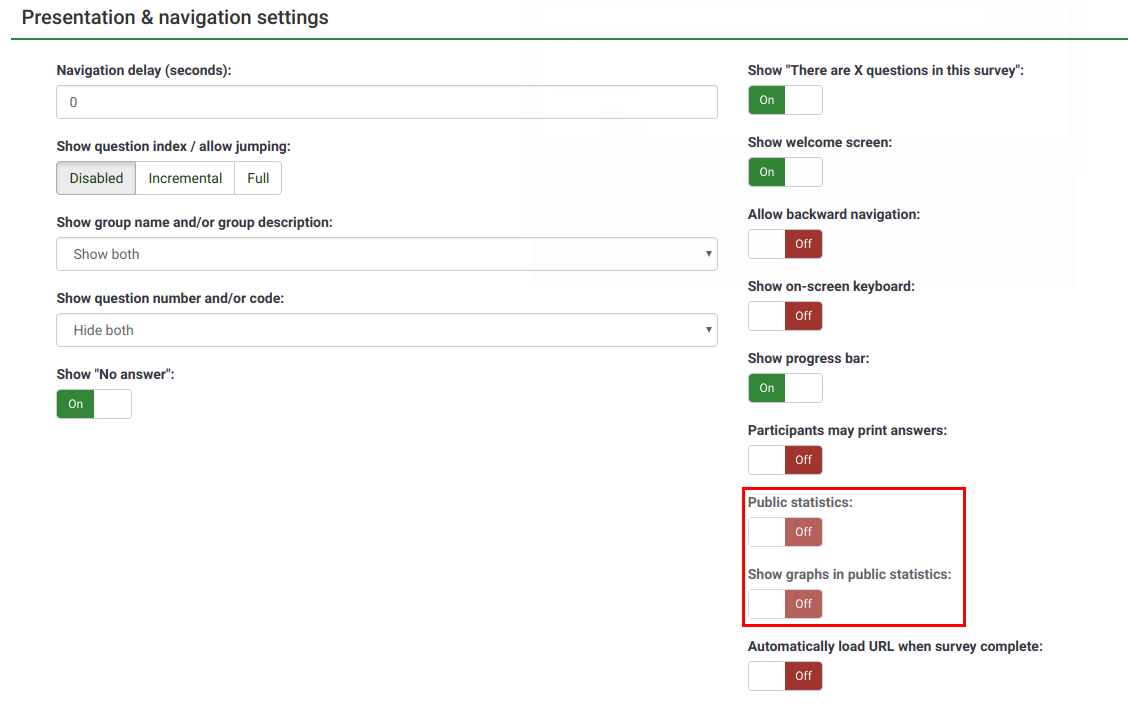
Za prikaz statistike anketirancem moramo izpolniti dva koraka. Najprej moramo omogočiti javno statistiko v nastavitvah ankete (privzeto je to onemogočeno). Ta nastavitev se nahaja v glavni orodni vrstici ankete (Lastnosti ankete -> Glavne nastavitve -> Predstavitev in navigacija -> Javne statistike?). Hkrati se tukaj nahaja nastavitev "Pokaži grafe v javnih statistikah?" – če jo aktiviramo – bo statistika vsebovala tudi grafe (privzeto statistika prikazuje le številčno obdelane podatke).
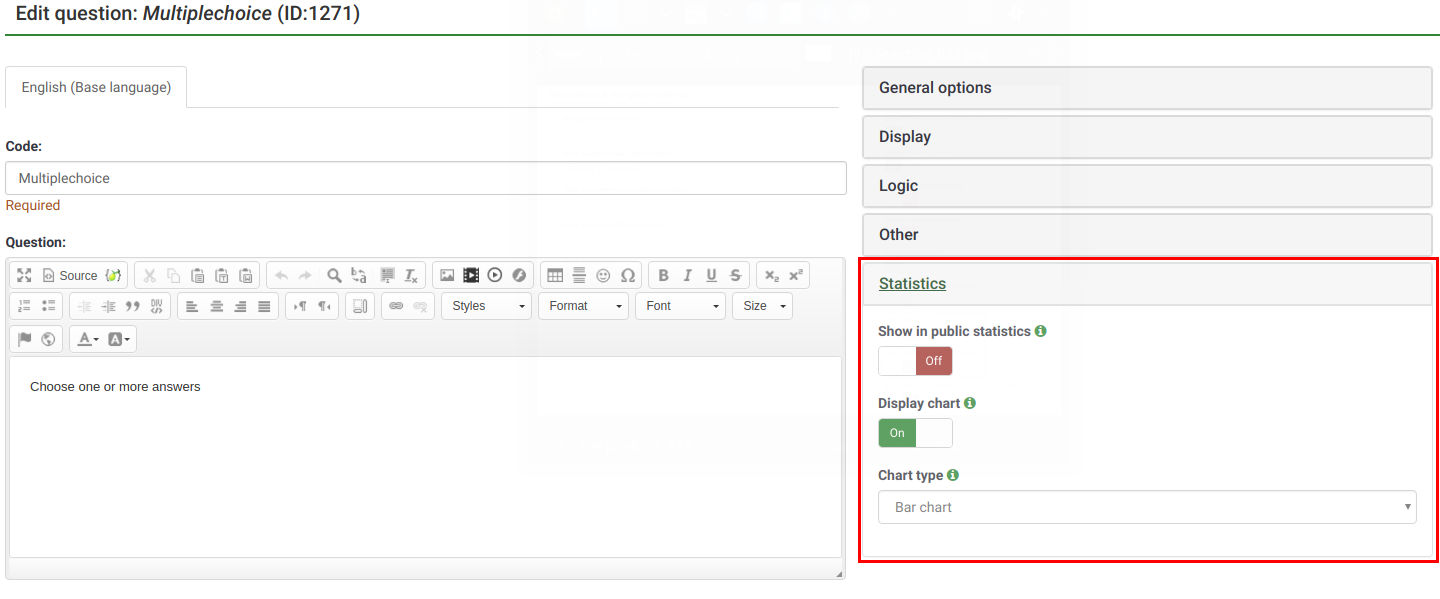
Torej z urejanjem posameznega vprašanja vi izberete katero vprašanje se naj prikaže v javno dostopni statistiki. To opcijo lahko pri posameznem vprašanju aktivirate v njenih Naprednih nastavitvah pri ("Javni prikaz statistik"). Vprašanje, ki ima to nastavitev nastavljeno na "Da", bo vprašanje vključeno v javno statistiko.
Kaj anketiranec vidi
Ko anketi enkrat aktiviramo nastavitev za javno statistiko in izberemo nekatera vprašanja za javni prikaz, bo anketirancem pri zaključevanju ankete prikazana dodatna možnost. Poleg običajne zahvale bo vidna tudi povezava "Prikaz statistik za to anketo".
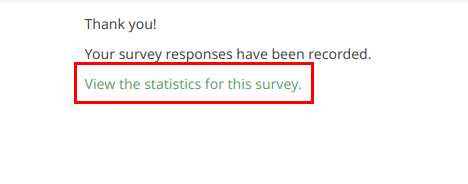
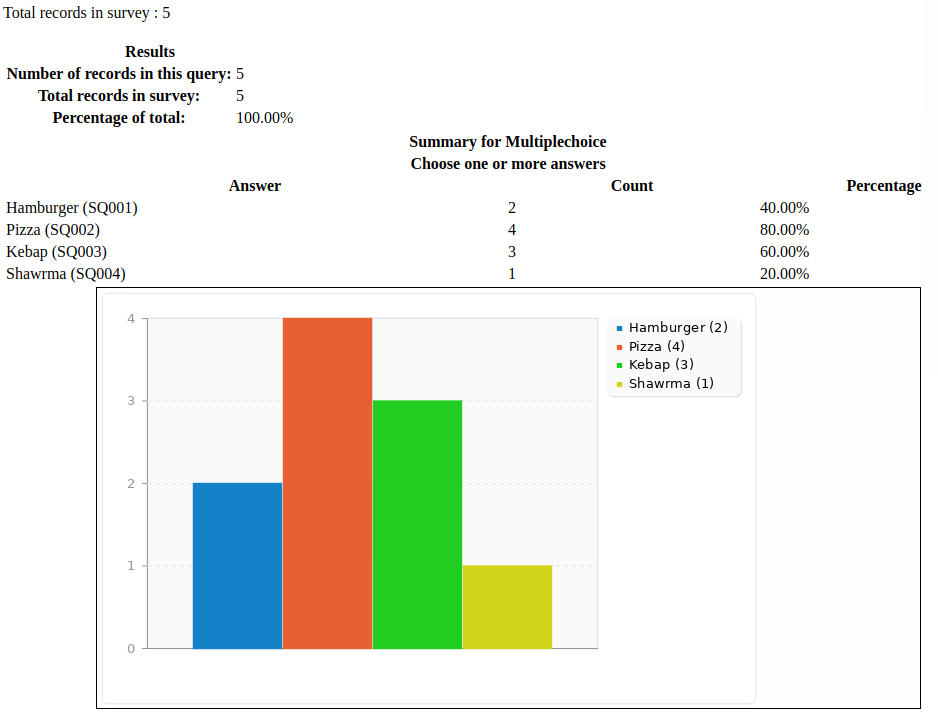
Če anketiranec klikne na to povezavo, bo lahko videl stran, ki vsebuje podrobnosti odgovorov izbranih vprašanj in grafe, če so le ti omogočeni.
Spreminjanje pogleda strani javne statistike
Stran, ki vsebuje javno statistiko, lahko urejamo preko LimeSurvey-evega urejevalnika predlog.
Hints & tips
Feel free to edit the following wiki sections to let other LimeSurvey users learn about statistics-related hints & tips.
Wrong font when exporting statistics - what to do?
Za določene jezike (npr. Kitajščina) običajno uporabljena pisava (Vera) ne zajema potrebnega nabora znakov. V tem primeru lahko uporabite nastavitev $chartfontfile, s katero nastavite novo TTF font datoteko v config.php (preveri config-defaults.php za pravo nastavitev). Za kitajščino (poenostavljeno ali tradicionalno) priporočamo uporabo fonta FireFlySung.
FAQs
5 Point choice question type - what do the values located under the "sum" column represent?
In the screenshot below, notice that the "Sum" column shows the aggregated values in the following way:
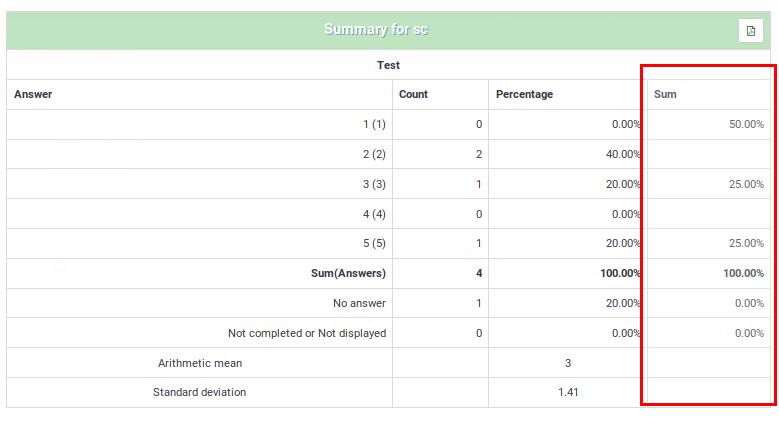
The grouping from the "Sum" column was done in this way because, when rating questions, survey administrators usually interpret the results in this way:
- Y percent of the participants DISLIKE item ABC, where Y represents the percentage of those who answered "1" and "2"
- X percent of the participants LIKE item ABC, where X represents the percentage of those who answered "4" and "5"
- Z percent of the participants have a NEUTRAL opinion about item ABC, where Z represents the percentage of those who answered "3"
| Answer | Count | Sum |
|---|---|---|
| 1 | 0 | 50% (the percentage of those who answered "1" and "2") |
| 2 | 2 | |
| 3 | 1 | 25% (the percentage of those who selected "3" - the neutral option) |
| 4 | 0 | |
| 5 | 1 | 25% (the sum of those who answered "4" and "5") |
| Sum (Answers) | 4 | 100% |
| No answer | 1 | 0% (always "0%") |
| Not completed or displayed | 0 | 0% (always "0%") |
