Statistics: Difference between revisions
From LimeSurvey Manual
mNo edit summary |
(Marked this version for translation) |
||
| (33 intermediate revisions by 3 users not shown) | |||
| Line 1: | Line 1: | ||
<languages /> <translate> | <languages /> <translate> | ||
<!--T:1--> | <!--T:1--> | ||
| Line 9: | Line 10: | ||
<!--T:43--> | <!--T:43--> | ||
The statistics feature is available from the responses toolbar by clicking first on the | The statistics feature is available from the responses toolbar by clicking first on the "Response and Statistics" menu entry located in the last drop-down menu, [[Responses]] (which is only available if a survey has been activated): | ||
<!--T:46--> | |||
<center>[[File:Location_responses_and_statistics.png]]</center> | <center>[[File:Location_responses_and_statistics.png]]</center> | ||
<!--T:47--> | |||
Look for the Statistics button located on the top toolbar and click on it: | Look for the Statistics button located on the top toolbar and click on it: | ||
<!--T:48--> | |||
<center>[[File:statistics.png]]</center> | <center>[[File:statistics.png]]</center> | ||
<!--T:49--> | |||
The following page will be loaded: | The following page will be loaded: | ||
<!--T:50--> | |||
<center>[[File:Statistics - start page.png]]</center> | <center>[[File:Statistics - start page.png]]</center> | ||
<!--T:51--> | |||
The LimeSurvey statistics can be visualized in either the '''expert mode''' or '''simple mode'''. By default, the '''expert mode''' is loaded when you click on the [[Statistics]] button. | |||
=Statistics - expert mode= <!--T:4--> | |||
<!--T:5--> | <!--T:5--> | ||
Let's say you've got a survey running, or it is finished and you want to start analyzing the results. LimeSurvey can dump all the results into an Excel spreadsheet | Let's say you've got a survey running, or it is finished and you want to start analyzing the results. LimeSurvey can dump all the results into an Excel spreadsheet or CSV file. You can do whatever you want with the data from the respective file. Alternatively, you can use the statistics feature to have a look at your data and start getting some useful information from it. | ||
<!--T:6--> | <!--T:6--> | ||
The statistics feature allows you to 'filter' your data and retrieve numbers and summaries of different fields from it. The statistics script doesn't attempt to do highly complex filtering, but you'd be surprised at the sort of information that can be easily obtained. | The statistics - expert mode feature allows you to 'filter' your data and retrieve numbers and summaries of different fields from it. The statistics script doesn't attempt to do highly complex filtering, but you'd be surprised at the sort of information that can be easily obtained. | ||
= | ==Running quick statistics== <!--T:7--> | ||
<!--T:8--> | <!--T:8--> | ||
As it can be observed below, there is a checkbox for each question that can be selected in order to show a summary | As it can be observed below, there is a checkbox for each question that can be selected in order to show a response summary for each question, and an icon that when clicked (or if the mouse hovers over it), it gives you the full text of the question. To view the results for a question or questions, check the checkbox(es) at the top of the question(s) and then click "View statistics". | ||
<!--T:52--> | |||
<center>[[File:Select answers and view statistics.png]]</center> | <center>[[File:Select answers and view statistics.png]]</center> | ||
Alternatively to view the results for all available questions, | <!--T:53--> | ||
Alternatively, to view the results for all available questions, enable "View summary of all available fields" and then click "View statistics": | |||
<!--T:54--> | |||
<center>[[File:View summary of all available fields.png]]</center> | <center>[[File:View summary of all available fields.png]]</center> | ||
<!--T:9--> | <!--T:9--> | ||
You will then be given a "Results" table which will indicate the number of cases and a "Field Summary" table for each question selected which | You will then be given a "Results" table which will indicate the number of cases and a "Field Summary" table for each question selected which summarizes all possible answers in the question(s), their totals, and their corresponding percentage. | ||
<!--T:55--> | |||
<center>[[File:Results view statistics.png]]</center> | <center>[[File:Results view statistics.png]]</center> | ||
<!--T:56--> | |||
{{Note|Please note that the statistics are displayed on the same page because the default [[Statistics#Output format and options|output format]] is HTML. If this is changed to PDF or Excel, then a pop-up will appear once the "View statistics" button is pressed, asking you to save the respective file on your machine.}} | |||
==Filtering data== <!--T:10--> | |||
<!--T:57--> | |||
Two types of filters exist: [[Statistics#General filters|general]] and [[Statistics#Response filters|response filters]]. | |||
===General filters=== <!--T:58--> | |||
<!--T:11--> | |||
As the name suggests, it refers to filters at the general (macro) level: | |||
<!--T:59--> | |||
<center>[[File:General filters - statistics.png]]</center> | |||
<!--T:60--> | |||
The filters can be related to: | The filters can be related to: | ||
<!--T:61--> | |||
* | * '''Data selection''' | ||
* | ** ''The type of responses:'' | ||
*** Complete responses: responses that contain a submission date | |||
*** Incomplete responses: answers that do not contain a submission date | |||
*** All records: the aggregated number of complete and incomplete responses. | |||
** ''Statistics report language:'' if additional languages are used, this filter option is useful to divide respondents based on the language they used to fill out your survey. | |||
<!--T:62--> | |||
{{Note|For a discussion on incomplete responses, see the [[Responses & statistics#Responses summary|response summary]] wiki section.}} | |||
* | <!--T:63--> | ||
<div class="simplebox"> Two attributes are located within the "Data selection" box: | |||
*'''View summary of all available field:''' it is turned off by default. By enabling it, all the survey questions and groups will be taken into account when running the statistics script | |||
*'''Subtotals based on displayed questions:''' it is deactivated by default. It counts stats for each question based only on the total number of responses for which the question was displayed (good way to filter the unfinished/incomplete responses).</div> | |||
<!--T:64--> | |||
* '''Response ID:''' use the ID number to filter your gathered responses | |||
<!--T:65--> | |||
* '''Submission date:''' displayed only if [[Notifications_%26_data#Save_timings|timings is enabled]]. You can filter the data based on the submission date of your collected responses. | |||
<!--T: | <!--T:66--> | ||
* | To get the answers filtered according only to the '''general filters''', enable the "View summary of all available field" option and click on the '''View statistics''' button located in the upper-right part of the screen. | ||
===Response filters=== <!--T:67--> | |||
<!--T:68--> | |||
Depending on the used [[Question types|question type]], different fields may be used to filter your answers: | |||
<!--T:69--> | |||
* '''By response:''' click on one or more responses in the list under each question to filter the data by those responses (use CTRL/click to select multiple responses in the same question). Note that if you choose to view the summary of all available fields (checkbox at top) you will need to select your response filters before checking that box. | |||
<!--T:70--> | |||
* '''By text:''' you can search the responses to a free text question type (and similar types) by entering a text. If you want to search for a partial string you can use the percentage sign (%) as wildcard. E.g.: If you look for 'Tom%', it will find entries with 'Tomb' and 'Tommy', etc. | |||
<!--T:71--> | |||
* '''By numerical value:''' you can search the responses that contain a certain numerical value if number-based question types are used. | |||
<!--T:72--> | |||
<center>[[File:Response filters - filtering options.png]]</center> | |||
<!--T:12--> | <!--T:12--> | ||
Selecting "View statistics" will then give you the "Results" table, indicating the number of responses matching your criteria, and a "Field Summary" table for each question selected which | Selecting "View statistics" will then give you the "Results" table, indicating the number of responses matching your criteria, and a "Field Summary" table for each question selected which summarizes all possible answers in the question(s), their totals and their percentage. It is important to note that these results are a subset of your total responses. So, for example, if your criteria display 146 records out of a total 180, the summary will show the breakdown of just those 146 records for that table. | ||
<!--T:13--> | <!--T:13--> | ||
| Line 126: | Line 173: | ||
<!--T:16--> | <!--T:16--> | ||
Things to be cautious of | {{Alert|title=Things to be cautious of| | ||
*If you set criteria on the same question that you ask for a summary, then that question will only present answers matching your criteria. So it is good practice not to set any criteria on the same question you are getting a summary of. | *If you set criteria on the same question that you ask for a summary, then that question will only present answers matching your criteria. So it is good practice '''not''' to set any criteria on the same question you are getting a summary of. | ||
*To select multiple entries for a question hold down the CTRL button when clicking. To | *To select multiple entries for a question hold down the CTRL button when clicking. To "unselect" the last criteria (if you want to clear all criteria from a question) click on the respective highlighted answer while holding pressed the CTRL button.}} | ||
==Graphs== <!--T:19--> | |||
<!--T:73--> | |||
{{Note|For technical reasons the Excel output does '''not''' contain any charts. If the PDF output is selected, charts are limited to pie charts (single choice questions) and bar charts (multiple choice question types).}} | |||
<!--T:20--> | |||
For charting, the library pChart is used, which is completely included and usually doesn't have to be configured. | |||
<!--T:22--> | |||
After the graphs have been generated you can export them easily. Right click on a graph and choose "Save image as", then save the graph as a .png file to your chosen location. | |||
<!--T:74--> | |||
You can also use the "Export images" function to save all the graphs to your machine: | |||
<!--T: | <!--T:75--> | ||
<center>[[File:Export images buttom.png]]</center> | |||
<!--T:76--> | |||
<div class="simplebox"> [[File:help.png]] Please note that LimeSurvey cannot create graphs from certain types of question. For example, the [[Question type - Numerical input|numerical input question type]] cannot be visualized with the help of graphs. However, a simple table with values such as count, sum, standard deviation, average, minimum, median, and maximum is displayed in its case: | |||
<!--T:77--> | |||
<center>[[File:Numerical question type statistics.png]]</center> | |||
<!--T:78--> | |||
To see which questions can make use of statistics and/or graphs, you have to read each question type manual entry from [[Question types|here]]. If tab statistics is available, check which options are displayed under this tab. Three statistics attributes exist: [[QS:Chart type|chart type]], [[QS:Display chart|display chart]], and [[QS:Public statistics|public statistics]].</div> | |||
="incomplete responses", "no answers" and not | =="incomplete responses", "no answers" and "not completed/not displayed" counts== <!--T:25--> | ||
<!--T:26--> | <!--T:26--> | ||
*'''incomplete responses''': all responses that started to be filled out by respondents, but weren't completed. A response started when the participant clicked the "Next" button in the survey, but did not click the "Submit" button in the end (did not land on the end page of your survey). | |||
<!--T:27--> | <!--T:27--> | ||
Technically speaking, this is when there is no SubmitDate in the response table for this entry, but new data set was created already. | Technically speaking, this is when there is no SubmitDate in the [[Responses|response table]] for this entry, but new data set was created already. | ||
<!--T:28--> | <!--T:28--> | ||
*'''no answer''': when the question was displayed, but the participant hasn't given an answer. | |||
<!--T:29--> | <!--T:29--> | ||
Technically speaking, this is when the question is not mandatory, was displayed, received no answer and the user clicked Next or Submit | Technically speaking, this is when the question is not mandatory, was displayed, received no answer and the user clicked "Next" or "Submit". The consequence is that the database field for this answer is set to "" (empty string). This "no answer" status cannot be really computed for "Date" or pure "Numerical questions" where the database field cannot record a string. | ||
<!--T:30--> | <!--T:30--> | ||
*'''not completed/not displayed''': when the page containing the question was not displayed. This can be because of conditions, or just because the participant left the survey before this page was displayed (or just while this page is displayed, but without clicking the Next button). | |||
<!--T:31--> | <!--T:31--> | ||
Technically speaking, the database field for this question is filled with a NULL value. | Technically speaking, the database field for this question is filled with a NULL value. | ||
==Output format and options== <!--T:79--> | |||
<!--T:80--> | |||
The statistics can be displayed under three different formats: | |||
<!--T:81--> | |||
<center>[[File:Output format - statistics.png]]</center> | |||
<!--T:82--> | |||
* '''HTML''' (default option): the statistics are displayed in LimeSurvey | |||
* '''PDF''': a popup will be displayed, asking to save the statistics as a PDF file | |||
* '''Excel''': To further work with your (filtered) data, choose Excel. You can export the file from a spreadsheet application to CSV to work with more advanced statistical tools such as SPSS or R. | |||
<!--T:83--> | |||
The output options can be used to alter the way in which the statistics are displayed. The following options are available: | |||
<!--T:84--> | |||
<center>[[File:Output options - statistics.png]]</center> | |||
<!--T:85--> | |||
*'''Show text responses inline:''' it is disabled by default. It shows the text questions responses without having to click on a browse button (if enabled; useful for the HTML version of output format) | |||
<!--T:86--> | |||
*'''Show graphs:''' it is disabled by default. If enabled, graphs will be displayed | |||
<!--T:87--> | |||
*'''Number of columns:''' two is the default number. If you wish to have statistics and graphs displayed on only one or three columns, choose the desired value from this option. It applies to HTML statistics. | |||
<!--T:88--> | |||
*'''Graph labels:''' choose how the label should look like in the graph. | |||
**''Question code'' | |||
**''Question text'' | |||
**''Both'' | |||
<!--T:89--> | |||
*'''Chart type:''' the following chart type settings are available: | |||
**''As defined in question settings:'' useful if you wish the graph not to be displayed. If this is the case, deactivate it from the question settings and select from the "Statistics" panel this option. | |||
**''Bar chart'' | |||
**''Pie chart'' | |||
**''Radar chart'' | |||
**''Line chart'' | |||
**''Polar chart'' | |||
**''Doughnut chart'' | |||
==Embed custom logo at statistic PDF== <!--T:113--> | |||
(available for Limesurvey 3.x since 12/2018) | |||
<!--T:114--> | |||
If you want to embed your own logo to the statistics PDF, then make sure a file named exactly "statistics.jpg" is placed within the "images" folder of the [[Custom_Admin_Themes|admin theme]] used for your system. Which admin theme is used can be set at the [[Global_settings#General|Global Settings]]. | |||
=Statistics - simple mode= <!--T:90--> | |||
<!--T:91--> | |||
The simple mode was created in order to provide simple bar chart statistics that can be quickly exported and saved, and then included into a presentation: | |||
<!--T:92--> | |||
<center>[[File:Simple mode - statistics.png]]</center> | |||
<!--T:93--> | |||
As you can observe, fewer graphs are displayed than in the expert mode. While in the export mode you can display graphs with respect to those who filled out the survey, did not answer it or did not finish completing it, the simple mode displays only statistics that rely on the "countable" data submitted by the respondents (e.g., single or multiple choice questions as well as array questions). | |||
<!--T:94--> | |||
There is only one option to filter the data within the simple mode - via the responses to be included in the statistics. As a result, the statistics may include the complete responses, incomplete responses, or all responses (the aggregated sum of the first two options). This option is located in the upper-right part of the panel. | |||
<!--T:95--> | |||
To switch back to [[Statistics#Statistics - expert mode|expert mode]], look for the "Expert mode" button located in the upper-right part of the screen: | |||
<!--T:96--> | |||
<center>[[File:Switch to expert mode.png]]</center> | |||
<!--T:97--> | |||
{{Note|If you wish to have direct access to the simple mode of Statistics, LimeSurvey allows you to create your own entries in the menu. For more information, check the [[Menu entries configuration|menu entries configuration wiki section]].}} | |||
| Line 185: | Line 322: | ||
<!--T:33--> | <!--T:33--> | ||
LimeSurvey includes functionality to display simple statistics to the general public or to your participants after they have | LimeSurvey includes the functionality to display simple statistics to the general public or to your participants after they have ended filling out an online survey. | ||
<!--T:34--> | <!--T:34--> | ||
Two components need to be enabled in order to activate and display statistics to your participants. The first one refers to the public statistics of your survey which must be enabled (it is turned off by default). It is located under the [[Presentation]] tab. To also show graphs, look on the same page for the [[Presentation#Show_graphs_in_public_statistics|Show graphs in public statistics attribute]] and enable it (it is disabled by default). | |||
<!--T:98--> | |||
<center>[[File:Presentation - public statistics.png]]</center> | |||
<!--T:36--> | <!--T:36--> | ||
Once you have set your survey to display statistics, you need to indicate question-by-question which statistics you want to be displayed to your respondents. By default, no questions will be displayed. To have them displayed, access the desired question, look for the "Statistics" tab and enable the [[QS:Public statistics|Show in public statistics]] attribute. | |||
<!--T:99--> | |||
<center>[[File:Statistics tab - public statistics.png]]</center> | |||
==What participants see== <!--T:38--> | |||
<!--T:39--> | <!--T:39--> | ||
Once you | Once you have enabled public statistics and selected some questions to display, an additional option will be visible to participants when they end filling out your survey. In addition to the usual thank you, there will be a link to "View the statistics for this survey": | ||
<!--T:100--> | |||
<center>[[File:Respondent - view statistics.png]]</center> | |||
<!--T:40--> | <!--T:40--> | ||
The survey statistics will be displayed on this page. Graphs can also be displayed by enabling the [[QS:Display chart|Display chart]] question attribute: | |||
<!--T:101--> | |||
<center>[[File:Display statistics to user.png]]</center> | |||
<!--T:102--> | |||
{{Note|Please note that only bar charts can be displayed in public statistics.}} | |||
==Changing the look of the public statistics page== <!--T:41--> | |||
<!--T:42--> | <!--T:42--> | ||
The looks of the public statistics page can be modified via template.css (search for "#statsContainer"). However, there is currently no template of it | The looks of the public statistics page can be modified via template.css (search for "#statsContainer"). However, there is currently no template of it's own that can be edited in the [[Theme editor|LimeSurvey theme editor]]. | ||
=Hints & tips= <!--T:103--> | |||
<!--T:104--> | |||
Feel free to edit the following wiki sections to let other LimeSurvey users learn about statistics-related hints & tips. | |||
==Wrong font when exporting statistics. What to do?== <!--T:105--> | |||
<!--T:21--> | |||
For some languages (like Chinese), the usual font used (Vera) does not cover the needed character set. In that case you can use the setting $chartfontfile to set a new TTF font file in config.php (Check out config-defaults.php for the right setting). For Chinese (Simplified and Traditional), another font has to be used such as the FireFlySung font which can be downloaded from [https://github.com/rougier/freetype-gl/blob/master/fonts/fireflysung.ttf github]. | |||
=FAQs= <!--T:106--> | |||
==5 point choice question type - what do the values located under the "Sum" column represent?== <!--T:107--> | |||
<!--T:108--> | |||
As it can be observed in the below screenshot, the '''"Sum"''' column shows the aggregated values in the following way: | |||
<!--T:109--> | |||
<center>[[File:Sum_column_SC.png]]</center> | |||
<!--T:110--> | |||
The grouping from the '''"Sum"''' column was done in this way because, when rating questions, survey administrators usually interpret the results in this way: | |||
<!--T:111--> | |||
*Y percent of the respondents '''DISLIKE''' item ABC, where Y represents the percentage of those who answered "1" and "2" | |||
*X percent of the respondents '''LIKE''' item ABC, where X represents the percentage of those who answered "4" and "5" | |||
*Z percent of the respondents have a '''NEUTRAL''' opinion about item ABC, where Z represents the percentage of those who answered "3" | |||
<!--T:112--> | |||
{| class="wikitable" style="text-align: left" | |||
!Answer | |||
!Count | |||
!Sum | |||
|- | |||
|1 | |||
|0 | |||
|50% (the percentage of those who answered "1" and "2") | |||
|- | |||
|2 | |||
|2 | |||
| | |||
|- | |||
|3 | |||
|1 | |||
|25% (the percentage of those who selected "3" - the neutral option) | |||
|- | |||
|4 | |||
|0 | |||
| | |||
|- | |||
|5 | |||
|1 | |||
|25% (the sum of those who answered "4" and "5") | |||
|- | |||
|Sum (Answers) | |||
|4 | |||
|100% | |||
|- | |||
|No answer | |||
|1 | |||
|0% (always "0%") | |||
|- | |||
|Not completed or displayed | |||
|0 | |||
|0% (always "0%") | |||
|-} | |||
</translate> | </translate> | ||
Revision as of 11:57, 12 November 2019
General
The statistics feature is available from the responses toolbar by clicking first on the "Response and Statistics" menu entry located in the last drop-down menu, Responses (which is only available if a survey has been activated):

Look for the Statistics button located on the top toolbar and click on it:

The following page will be loaded:

The LimeSurvey statistics can be visualized in either the expert mode or simple mode. By default, the expert mode is loaded when you click on the Statistics button.
Statistics - expert mode
Let's say you've got a survey running, or it is finished and you want to start analyzing the results. LimeSurvey can dump all the results into an Excel spreadsheet or CSV file. You can do whatever you want with the data from the respective file. Alternatively, you can use the statistics feature to have a look at your data and start getting some useful information from it.
The statistics - expert mode feature allows you to 'filter' your data and retrieve numbers and summaries of different fields from it. The statistics script doesn't attempt to do highly complex filtering, but you'd be surprised at the sort of information that can be easily obtained.
Running quick statistics
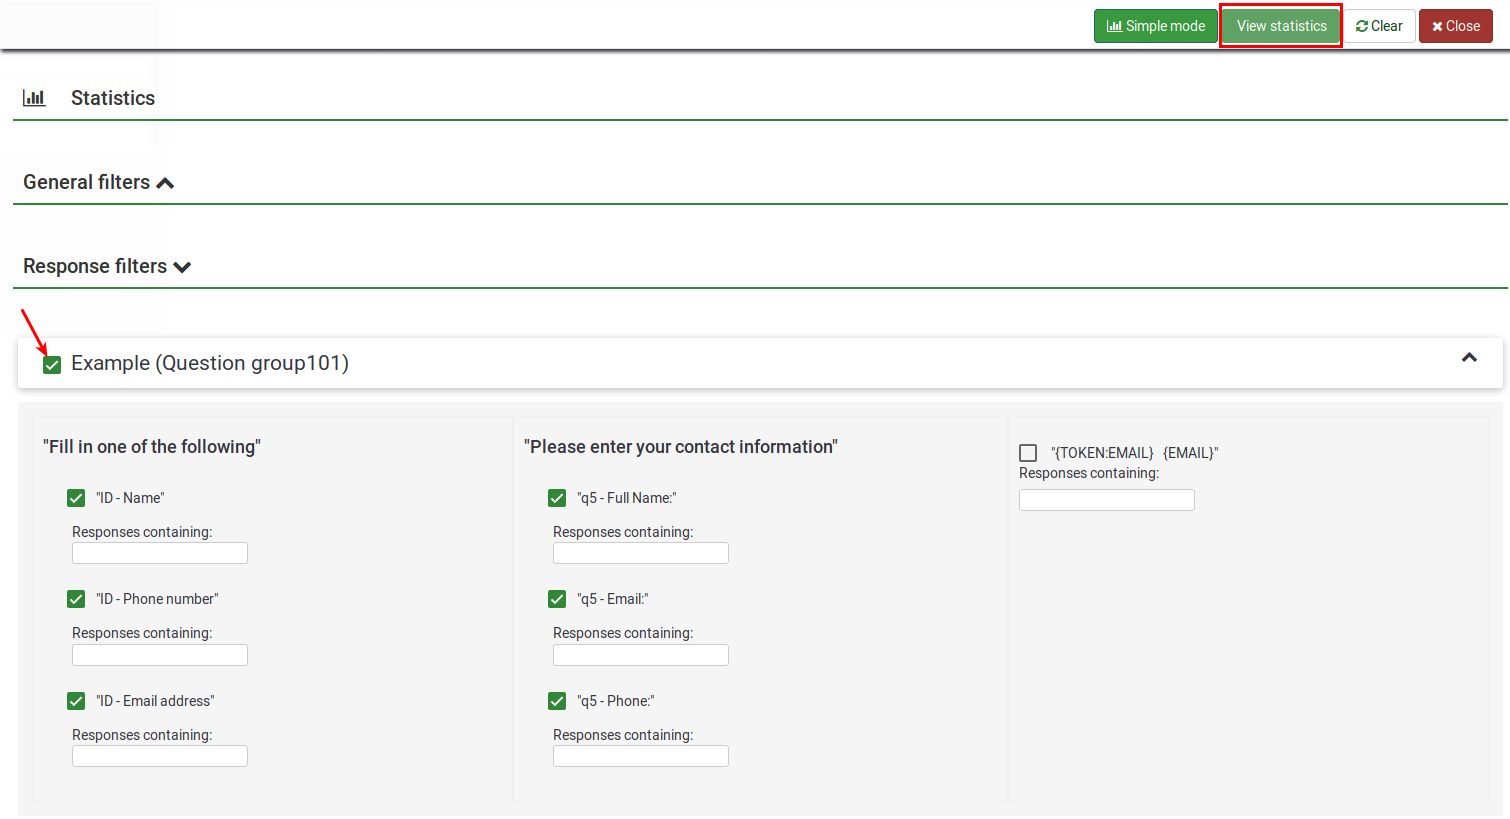
As it can be observed below, there is a checkbox for each question that can be selected in order to show a response summary for each question, and an icon that when clicked (or if the mouse hovers over it), it gives you the full text of the question. To view the results for a question or questions, check the checkbox(es) at the top of the question(s) and then click "View statistics".
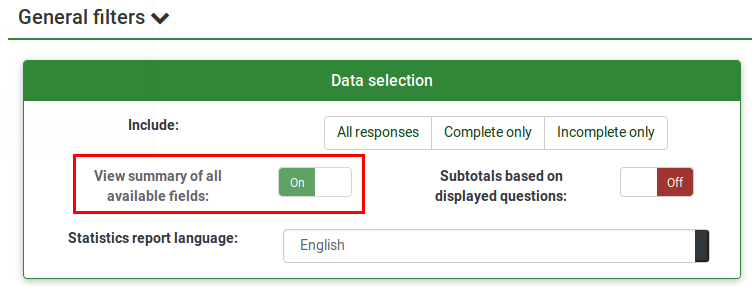
Alternatively, to view the results for all available questions, enable "View summary of all available fields" and then click "View statistics":
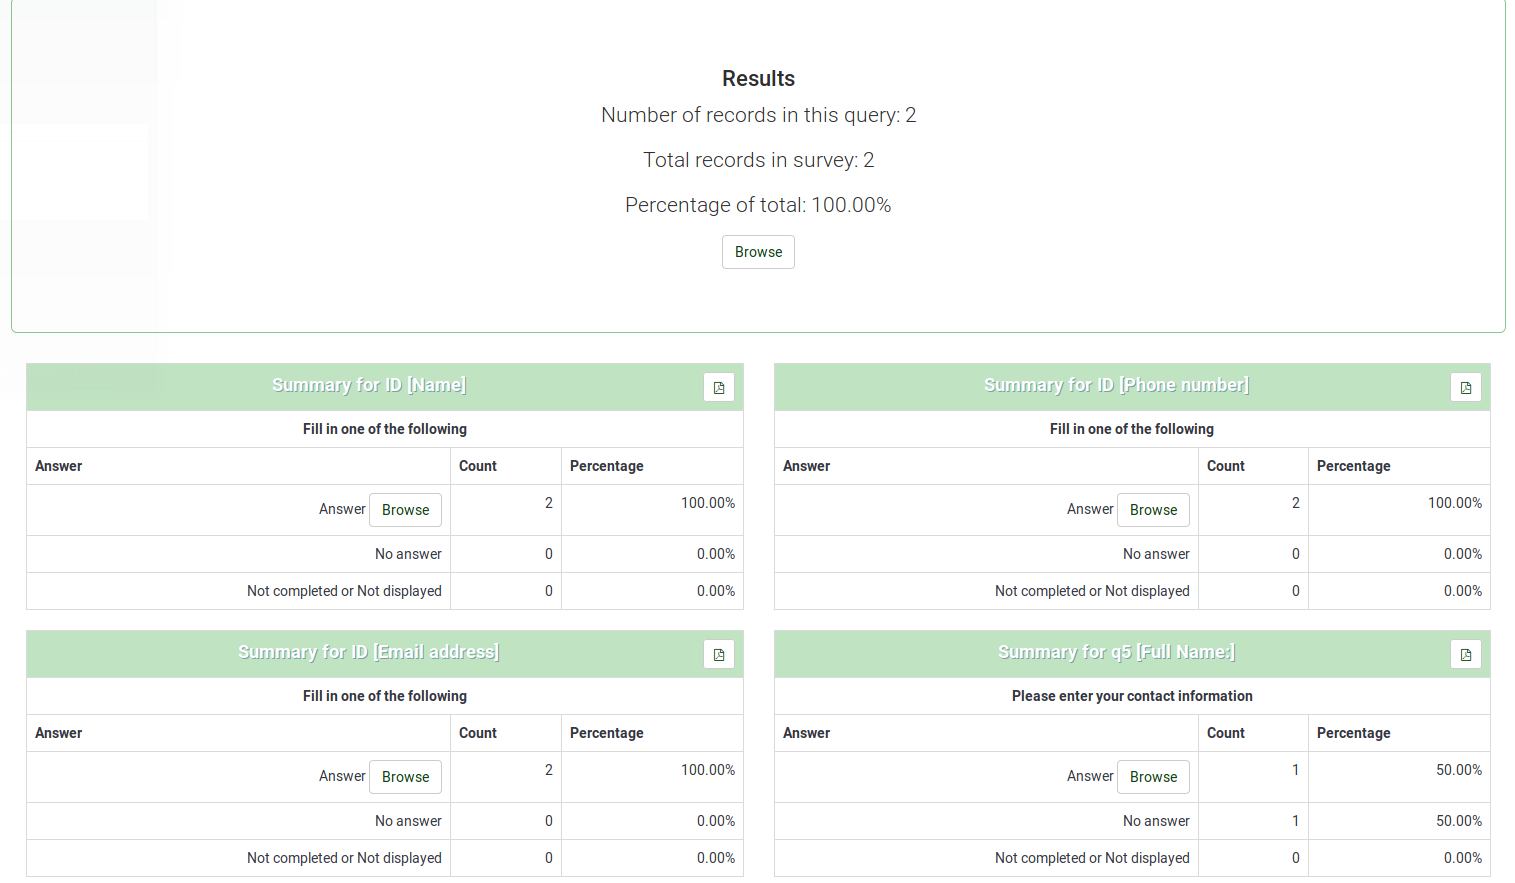
You will then be given a "Results" table which will indicate the number of cases and a "Field Summary" table for each question selected which summarizes all possible answers in the question(s), their totals, and their corresponding percentage.
Filtering data
Two types of filters exist: general and response filters.
General filters
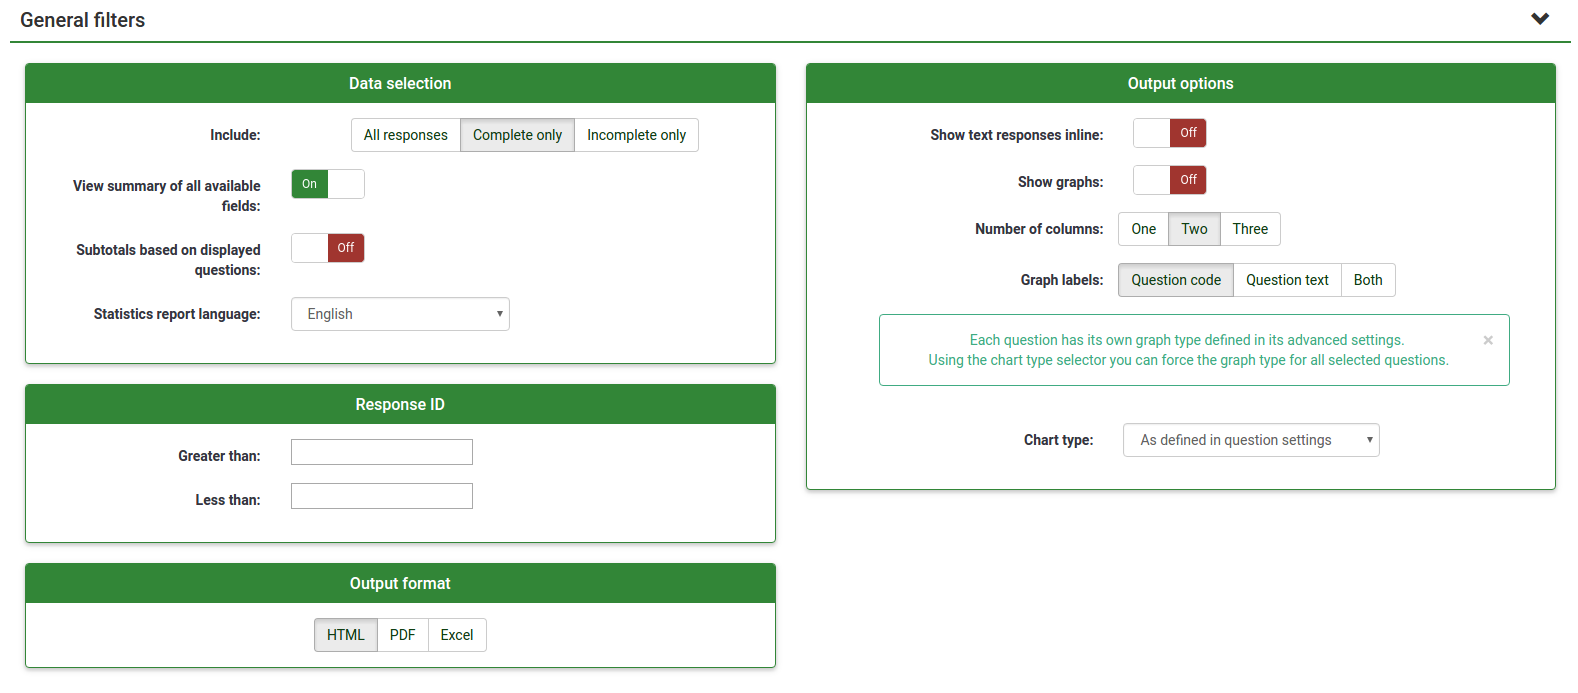
As the name suggests, it refers to filters at the general (macro) level:
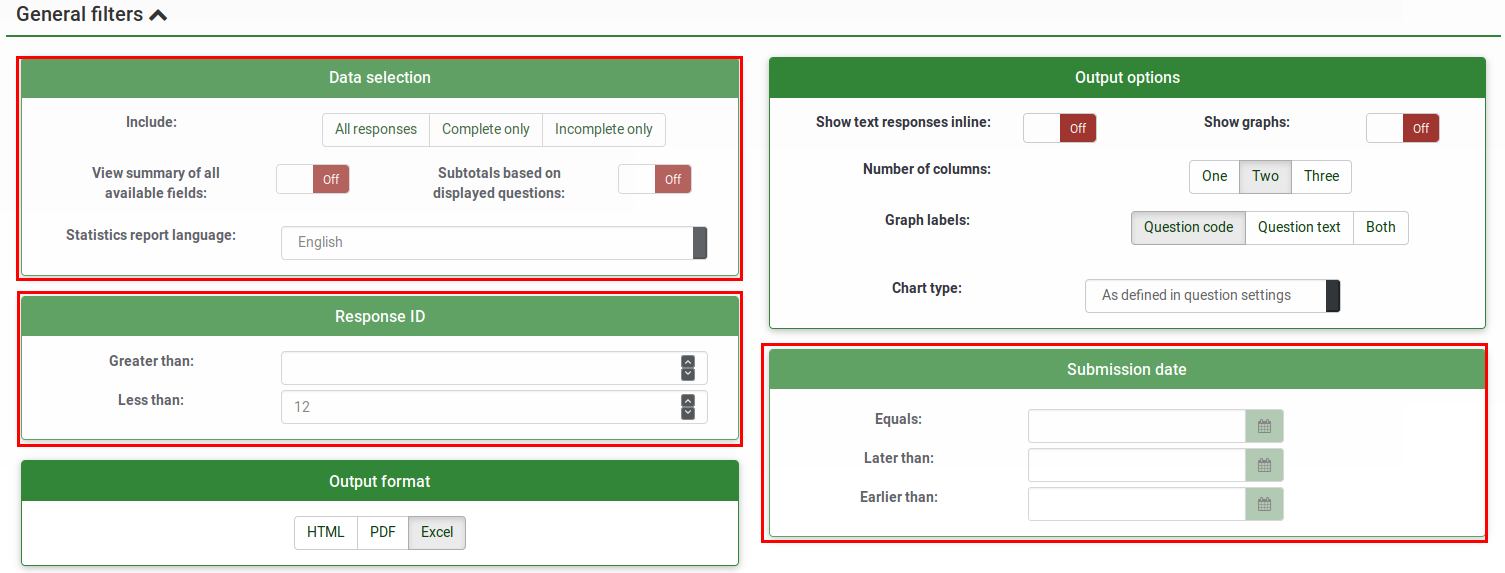
The filters can be related to:
- Data selection
- The type of responses:
- Complete responses: responses that contain a submission date
- Incomplete responses: answers that do not contain a submission date
- All records: the aggregated number of complete and incomplete responses.
- Statistics report language: if additional languages are used, this filter option is useful to divide respondents based on the language they used to fill out your survey.
- The type of responses:
- View summary of all available field: it is turned off by default. By enabling it, all the survey questions and groups will be taken into account when running the statistics script
- Subtotals based on displayed questions: it is deactivated by default. It counts stats for each question based only on the total number of responses for which the question was displayed (good way to filter the unfinished/incomplete responses).
- Response ID: use the ID number to filter your gathered responses
- Submission date: displayed only if timings is enabled. You can filter the data based on the submission date of your collected responses.
To get the answers filtered according only to the general filters, enable the "View summary of all available field" option and click on the View statistics button located in the upper-right part of the screen.
Response filters
Depending on the used question type, different fields may be used to filter your answers:
- By response: click on one or more responses in the list under each question to filter the data by those responses (use CTRL/click to select multiple responses in the same question). Note that if you choose to view the summary of all available fields (checkbox at top) you will need to select your response filters before checking that box.
- By text: you can search the responses to a free text question type (and similar types) by entering a text. If you want to search for a partial string you can use the percentage sign (%) as wildcard. E.g.: If you look for 'Tom%', it will find entries with 'Tomb' and 'Tommy', etc.
- By numerical value: you can search the responses that contain a certain numerical value if number-based question types are used.
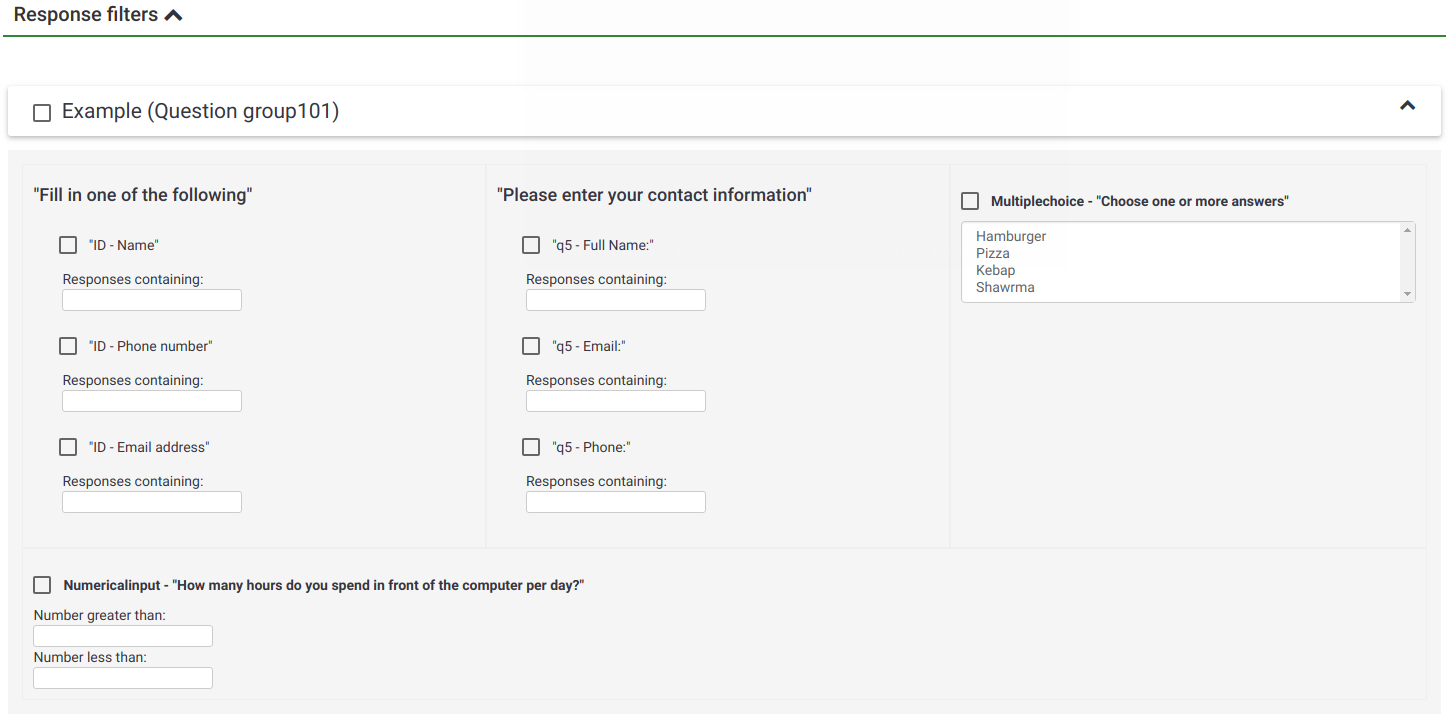
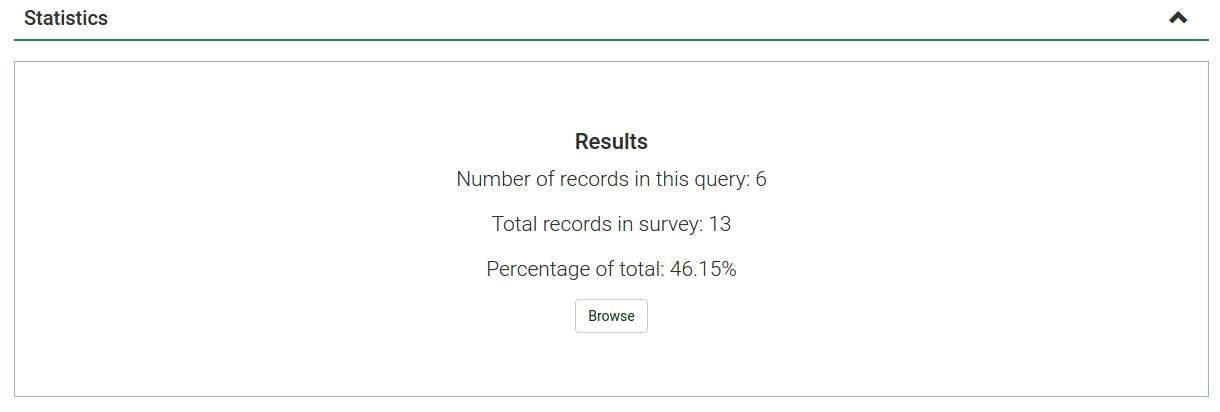
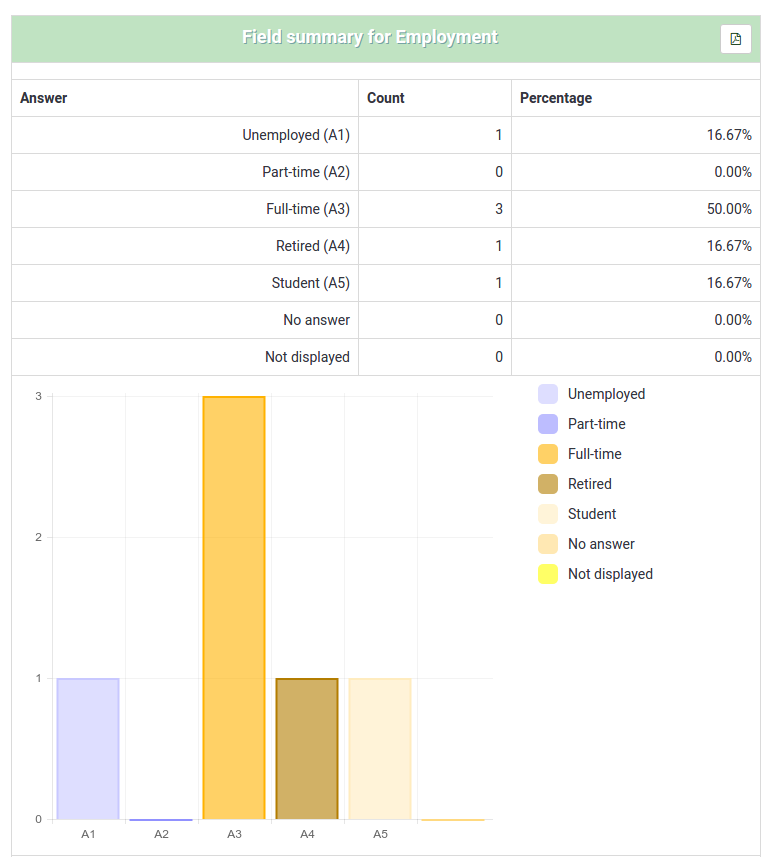
Selecting "View statistics" will then give you the "Results" table, indicating the number of responses matching your criteria, and a "Field Summary" table for each question selected which summarizes all possible answers in the question(s), their totals and their percentage. It is important to note that these results are a subset of your total responses. So, for example, if your criteria display 146 records out of a total 180, the summary will show the breakdown of just those 146 records for that table.
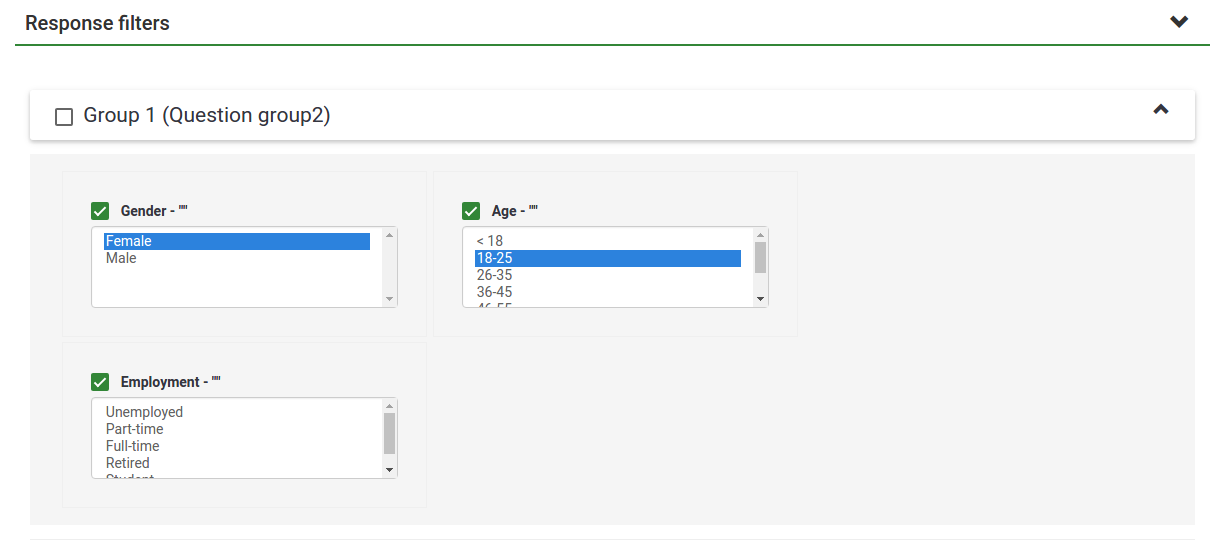
The images below indicate that I have elected to view the stats for "Employment status" of completed records/female/age 18-25. This gives me the results for 6 out of 13 records.
- If you set criteria on the same question that you ask for a summary, then that question will only present answers matching your criteria. So it is good practice not to set any criteria on the same question you are getting a summary of.
- To select multiple entries for a question hold down the CTRL button when clicking. To "unselect" the last criteria (if you want to clear all criteria from a question) click on the respective highlighted answer while holding pressed the CTRL button.
Graphs
For charting, the library pChart is used, which is completely included and usually doesn't have to be configured.
After the graphs have been generated you can export them easily. Right click on a graph and choose "Save image as", then save the graph as a .png file to your chosen location.
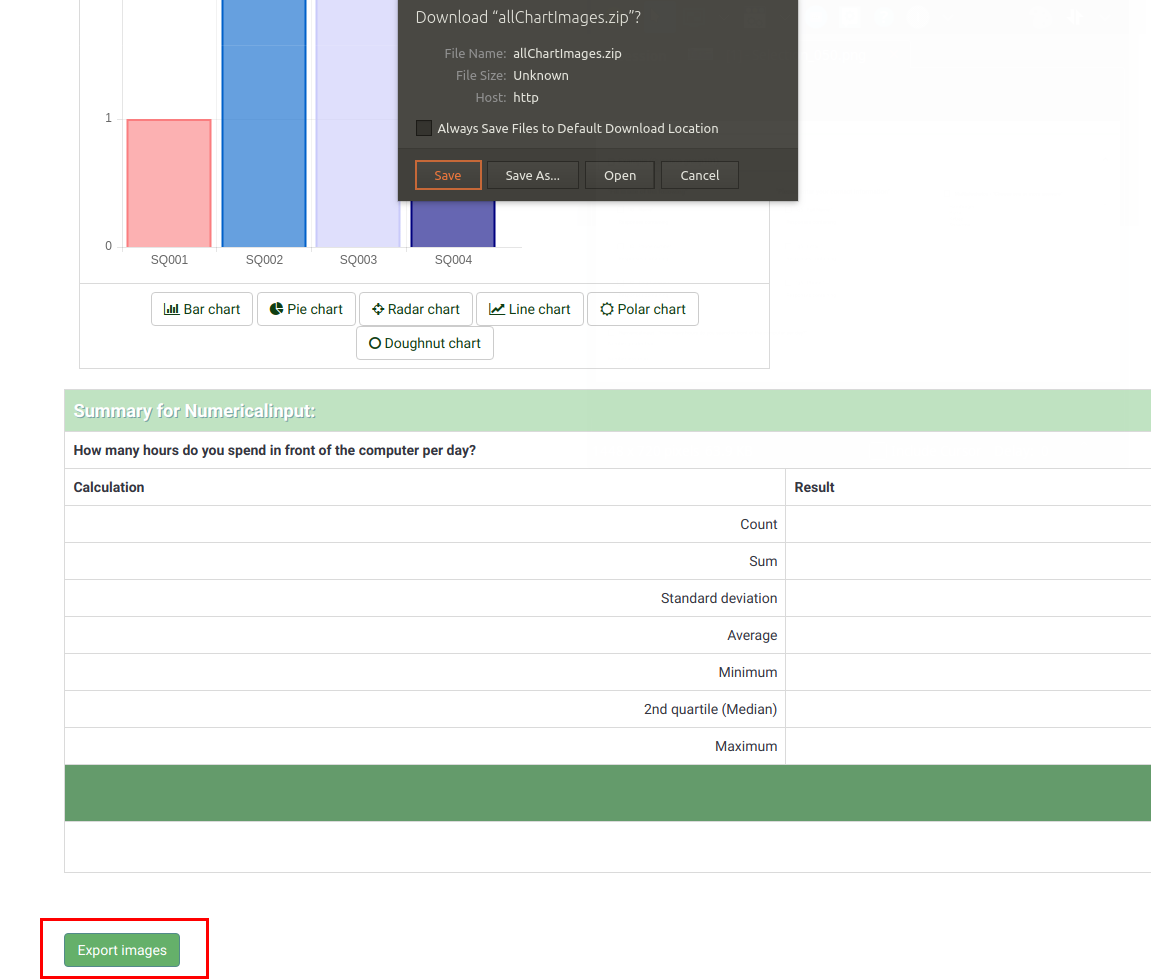
You can also use the "Export images" function to save all the graphs to your machine:
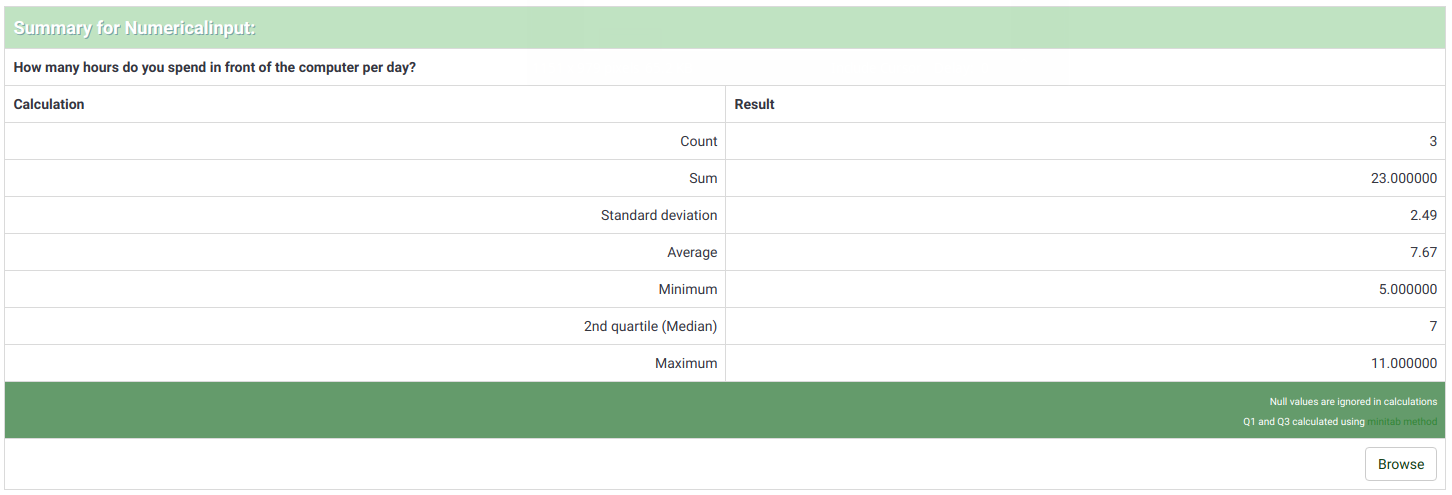
"incomplete responses", "no answers" and "not completed/not displayed" counts
- incomplete responses: all responses that started to be filled out by respondents, but weren't completed. A response started when the participant clicked the "Next" button in the survey, but did not click the "Submit" button in the end (did not land on the end page of your survey).
Technically speaking, this is when there is no SubmitDate in the response table for this entry, but new data set was created already.
- no answer: when the question was displayed, but the participant hasn't given an answer.
Technically speaking, this is when the question is not mandatory, was displayed, received no answer and the user clicked "Next" or "Submit". The consequence is that the database field for this answer is set to "" (empty string). This "no answer" status cannot be really computed for "Date" or pure "Numerical questions" where the database field cannot record a string.
- not completed/not displayed: when the page containing the question was not displayed. This can be because of conditions, or just because the participant left the survey before this page was displayed (or just while this page is displayed, but without clicking the Next button).
Technically speaking, the database field for this question is filled with a NULL value.
Output format and options
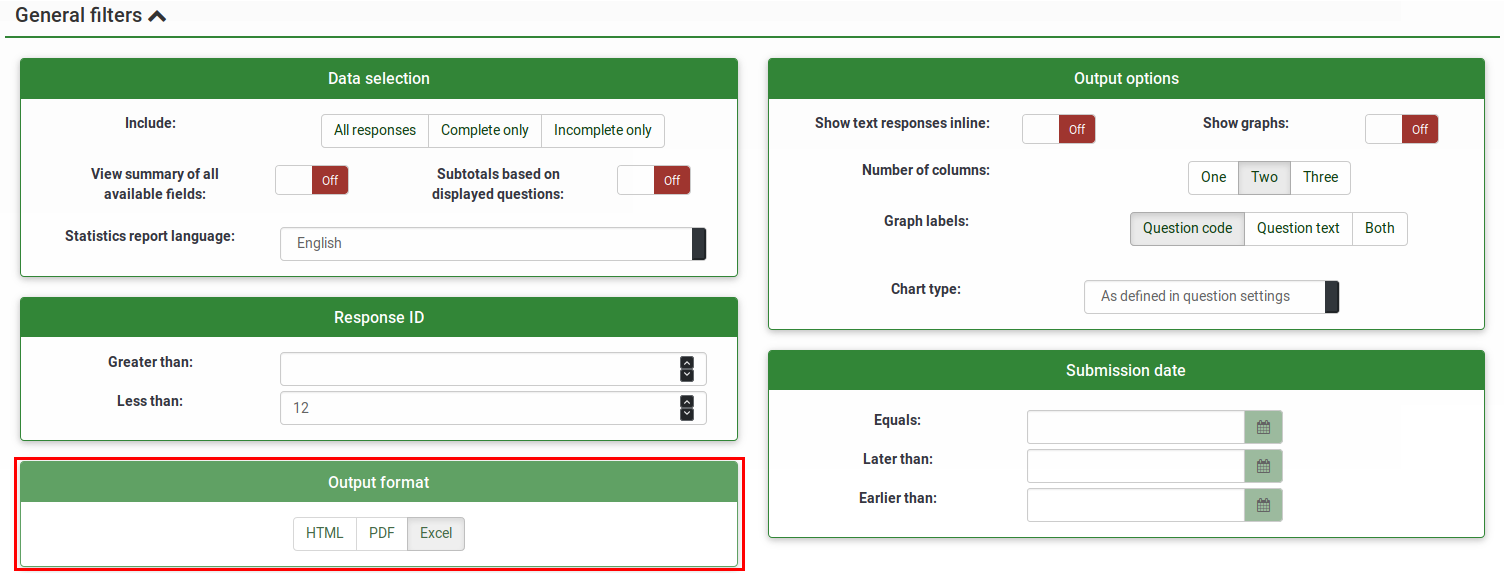
The statistics can be displayed under three different formats:
- HTML (default option): the statistics are displayed in LimeSurvey
- PDF: a popup will be displayed, asking to save the statistics as a PDF file
- Excel: To further work with your (filtered) data, choose Excel. You can export the file from a spreadsheet application to CSV to work with more advanced statistical tools such as SPSS or R.
The output options can be used to alter the way in which the statistics are displayed. The following options are available:
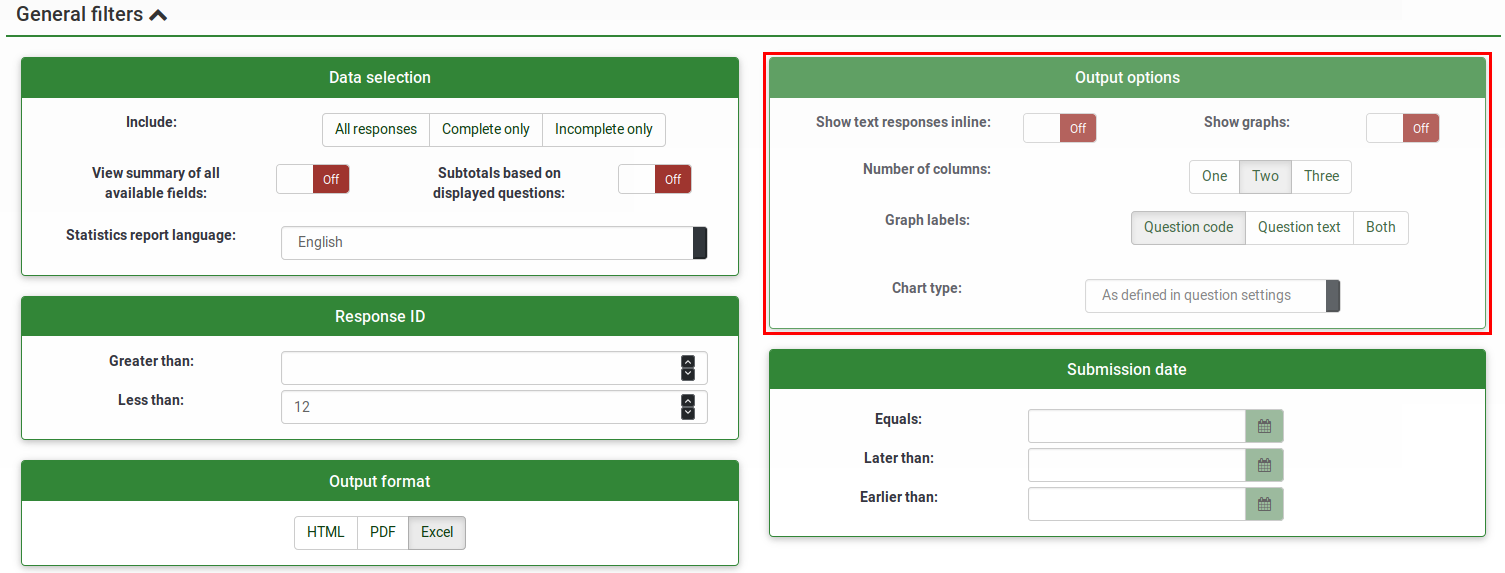
- Show text responses inline: it is disabled by default. It shows the text questions responses without having to click on a browse button (if enabled; useful for the HTML version of output format)
- Show graphs: it is disabled by default. If enabled, graphs will be displayed
- Number of columns: two is the default number. If you wish to have statistics and graphs displayed on only one or three columns, choose the desired value from this option. It applies to HTML statistics.
- Graph labels: choose how the label should look like in the graph.
- Question code
- Question text
- Both
- Chart type: the following chart type settings are available:
- As defined in question settings: useful if you wish the graph not to be displayed. If this is the case, deactivate it from the question settings and select from the "Statistics" panel this option.
- Bar chart
- Pie chart
- Radar chart
- Line chart
- Polar chart
- Doughnut chart
Embed custom logo at statistic PDF
(available for Limesurvey 3.x since 12/2018)
If you want to embed your own logo to the statistics PDF, then make sure a file named exactly "statistics.jpg" is placed within the "images" folder of the admin theme used for your system. Which admin theme is used can be set at the Global Settings.
Statistics - simple mode
The simple mode was created in order to provide simple bar chart statistics that can be quickly exported and saved, and then included into a presentation:
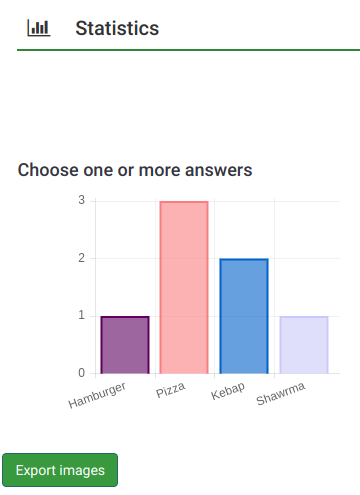
As you can observe, fewer graphs are displayed than in the expert mode. While in the export mode you can display graphs with respect to those who filled out the survey, did not answer it or did not finish completing it, the simple mode displays only statistics that rely on the "countable" data submitted by the respondents (e.g., single or multiple choice questions as well as array questions).
There is only one option to filter the data within the simple mode - via the responses to be included in the statistics. As a result, the statistics may include the complete responses, incomplete responses, or all responses (the aggregated sum of the first two options). This option is located in the upper-right part of the panel.
To switch back to expert mode, look for the "Expert mode" button located in the upper-right part of the screen:

Public Statistics
LimeSurvey includes the functionality to display simple statistics to the general public or to your participants after they have ended filling out an online survey.
Two components need to be enabled in order to activate and display statistics to your participants. The first one refers to the public statistics of your survey which must be enabled (it is turned off by default). It is located under the Presentation tab. To also show graphs, look on the same page for the Show graphs in public statistics attribute and enable it (it is disabled by default).
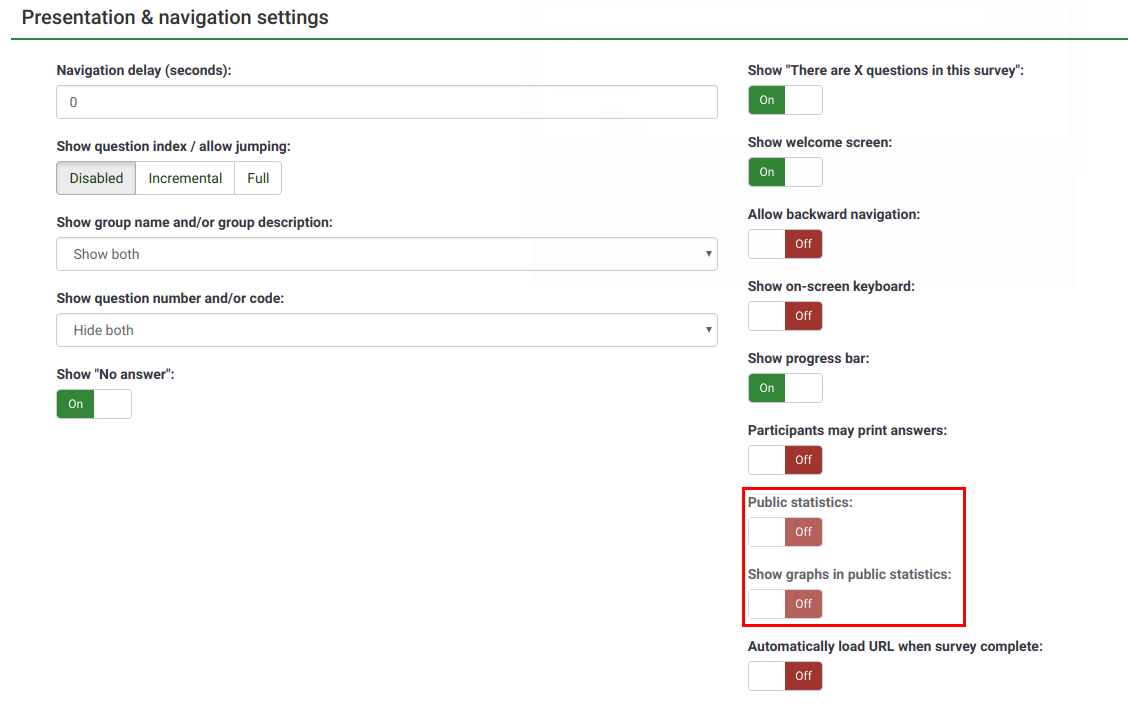
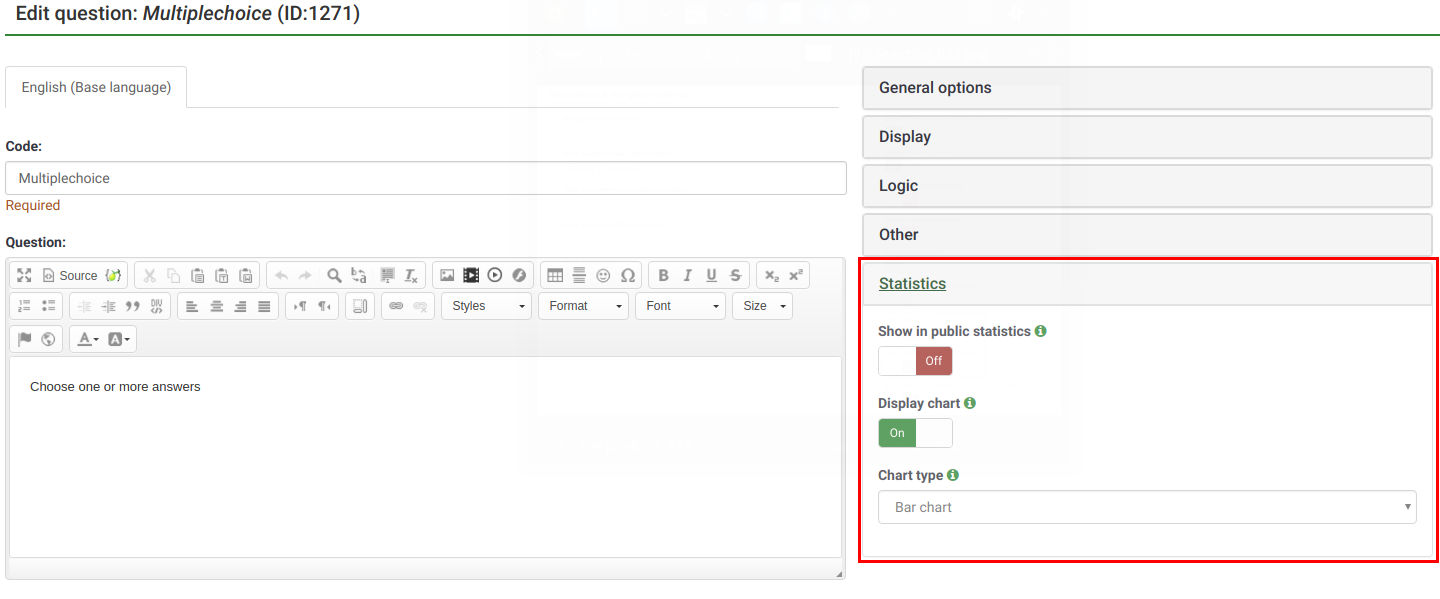
Once you have set your survey to display statistics, you need to indicate question-by-question which statistics you want to be displayed to your respondents. By default, no questions will be displayed. To have them displayed, access the desired question, look for the "Statistics" tab and enable the Show in public statistics attribute.
What participants see
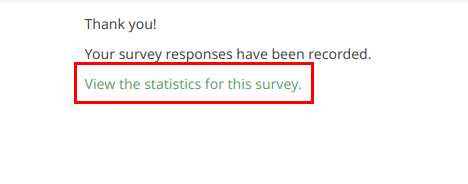
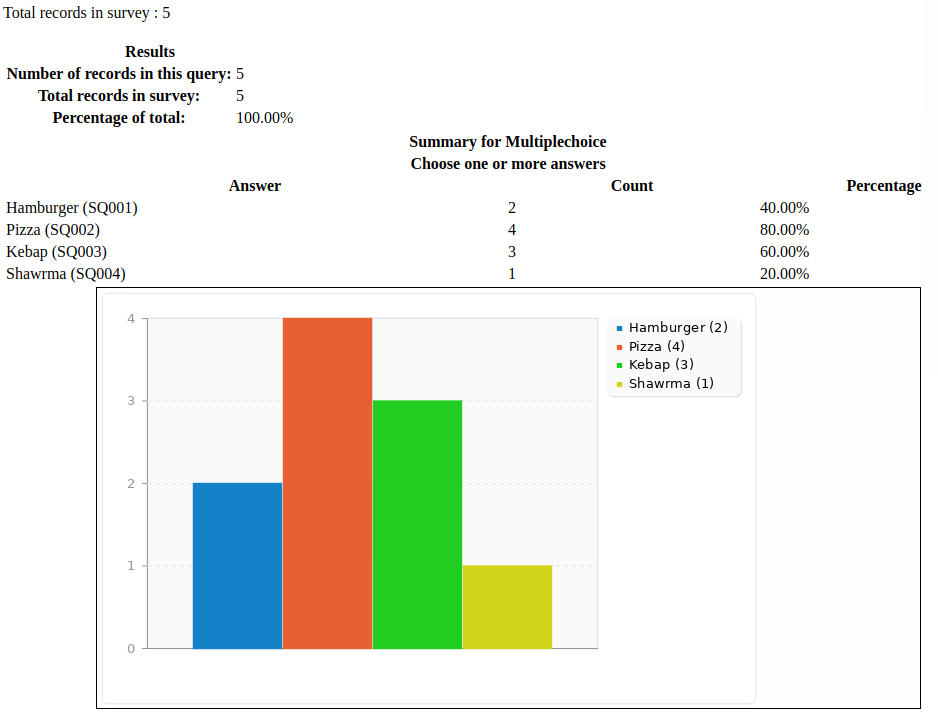
Once you have enabled public statistics and selected some questions to display, an additional option will be visible to participants when they end filling out your survey. In addition to the usual thank you, there will be a link to "View the statistics for this survey":
The survey statistics will be displayed on this page. Graphs can also be displayed by enabling the Display chart question attribute:
Changing the look of the public statistics page
The looks of the public statistics page can be modified via template.css (search for "#statsContainer"). However, there is currently no template of it's own that can be edited in the LimeSurvey theme editor.
Hints & tips
Feel free to edit the following wiki sections to let other LimeSurvey users learn about statistics-related hints & tips.
Wrong font when exporting statistics. What to do?
For some languages (like Chinese), the usual font used (Vera) does not cover the needed character set. In that case you can use the setting $chartfontfile to set a new TTF font file in config.php (Check out config-defaults.php for the right setting). For Chinese (Simplified and Traditional), another font has to be used such as the FireFlySung font which can be downloaded from github.
FAQs
5 point choice question type - what do the values located under the "Sum" column represent?
As it can be observed in the below screenshot, the "Sum" column shows the aggregated values in the following way:
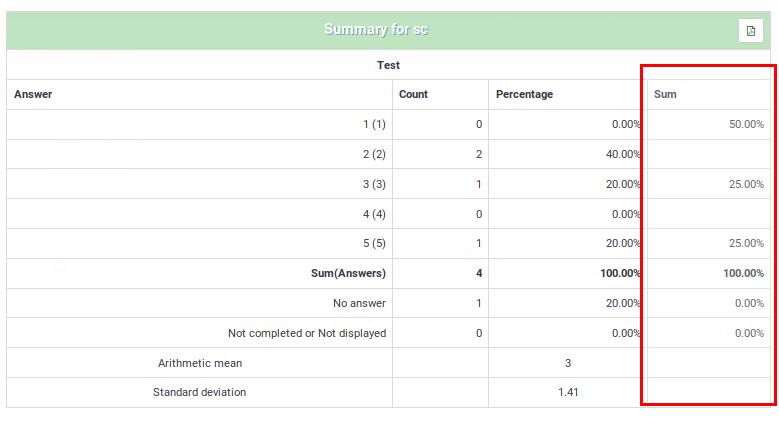
The grouping from the "Sum" column was done in this way because, when rating questions, survey administrators usually interpret the results in this way:
- Y percent of the respondents DISLIKE item ABC, where Y represents the percentage of those who answered "1" and "2"
- X percent of the respondents LIKE item ABC, where X represents the percentage of those who answered "4" and "5"
- Z percent of the respondents have a NEUTRAL opinion about item ABC, where Z represents the percentage of those who answered "3"
| Answer | Count | Sum |
|---|---|---|
| 1 | 0 | 50% (the percentage of those who answered "1" and "2") |
| 2 | 2 | |
| 3 | 1 | 25% (the percentage of those who selected "3" - the neutral option) |
| 4 | 0 | |
| 5 | 1 | 25% (the sum of those who answered "4" and "5") |
| Sum (Answers) | 4 | 100% |
| No answer | 1 | 0% (always "0%") |
| Not completed or displayed | 0 | 0% (always "0%") |